
Figures & data
Table 1 Characteristics of the study population
Figure 1 Dose-response relationship between the number of prescription drugs and the risk of injurious fall.
Abbreviation: FRID, fall-risk increasing drug.
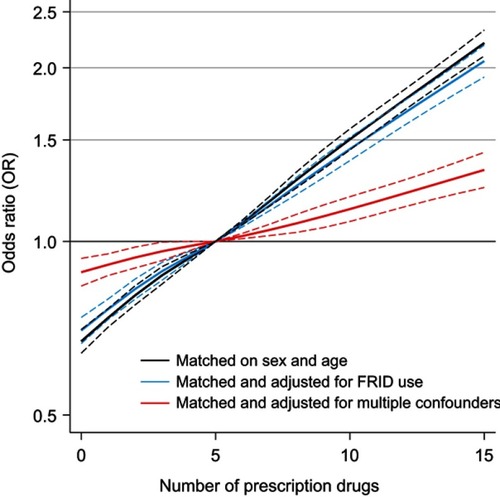
Table 2 Association between the number of prescription drugs and risk of injurious fall
Figure 2 Population attributable fraction (PAF). aOdds Ratios and their 95% confidence intervals were computed by the mean of unconditional logistic regression models adjusted for sex, age, number of fall-risk increasing drugs (FRIDs), living arrangement, number of chronic diseases, history of fall-related hospital admission, and history of alcohol-related hospital admission. bThe population attributable fraction (PAF) can be calculated as PAF = Pe × [(OR-1) ÷ OR], where Pe is the prevalence rate of the exposure among cases.
![Figure 2 Population attributable fraction (PAF). aOdds Ratios and their 95% confidence intervals were computed by the mean of unconditional logistic regression models adjusted for sex, age, number of fall-risk increasing drugs (FRIDs), living arrangement, number of chronic diseases, history of fall-related hospital admission, and history of alcohol-related hospital admission. bThe population attributable fraction (PAF) can be calculated as PAF = Pe × [(OR-1) ÷ OR], where Pe is the prevalence rate of the exposure among cases.](/cms/asset/ff0f51f4-3d24-4899-a4c5-b7e951f2539a/dcle_a_12163128_f0002_b.jpg)
Availability of data and materials
Patient-level data from the Swedish Prescribed Drugs Register and other healthcare registers cannot be made publicly available. Interested researchers can access the aggregated data from the Swedish Prescribed Drugs Register (www.socialstyrelsen.se/statistik/statistikdatabas/lakemedel). Additional data can be obtained upon reasonable request to the authors.