
Figures & data
Figure 1 Flowchart of study population inclusion.
Abbreviations: CPRD, Clinical Practice Research Datalink; IMD, Index of Multiple Deprivation.
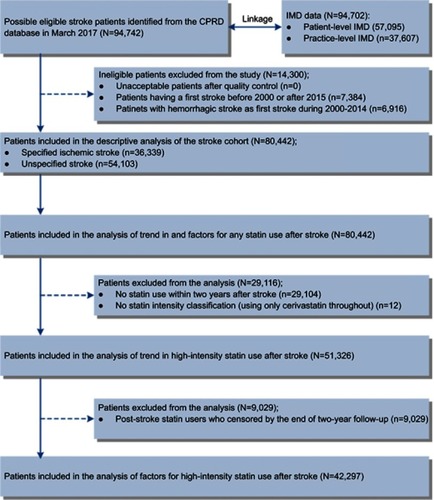
Table 1 Characteristics of the stroke cohort by statin use after stroke
Figure 2 Trend in statin and intensity use after stroke.
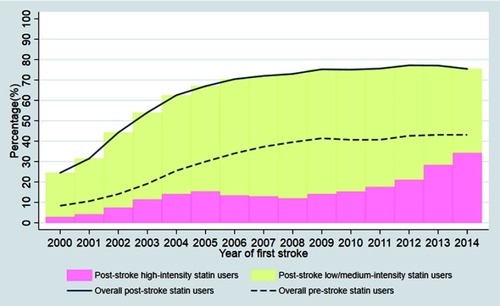
Figure 3 Trend in statin and intensity use after stroke by prior statin use ((A) no pre-stroke statin use; (B) pre-stroke statin use).
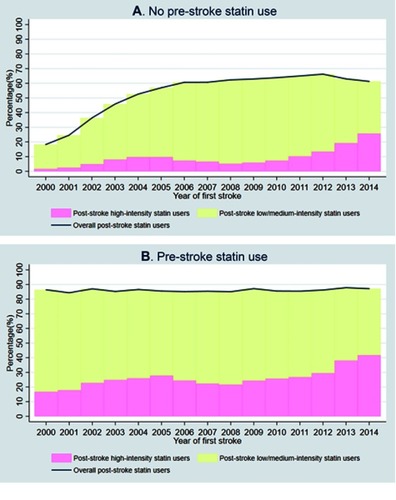
Table 2 Factors associated with statin use and high-intensity statin use within 2 years after stroke
Table 3 Factors associated with different chances of using a statin after ischemic stroke, and a high-intensity statin if used