
Figures & data
Figure 1 Inclusion and exclusion flow-chart for the study population, including screening participation according to HPV vaccination status.
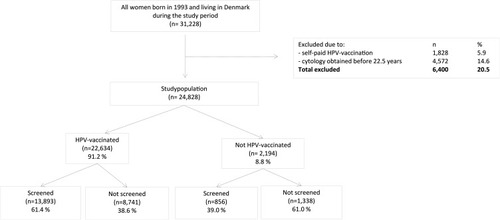
Table 1 Socio-Economic Characteristics Of The Study Population And Their Parents, Stratified By Combined Attendance In The Two Preventive Programs Against Cervical Cancer
Table 2 Unadjusted And Adjusted Odds Ratios With 95% Confidence Intervals (CIs) For Not Participation In Cervical Cancer Screening
Table 3 Models Testing The Interaction By Country Of Origin (Model 1) And Highest Parental Education (Model 2) On The Association Between Non-vaccination And Cervical Cancer Screening Non-participation