Figures & data
Table 1 Baseline characteristics and one-year mortality in the PREDICE and AHEAD cohorts
Table 2 Baseline characteristics of the PREDICE validation cohort according one-year mortality
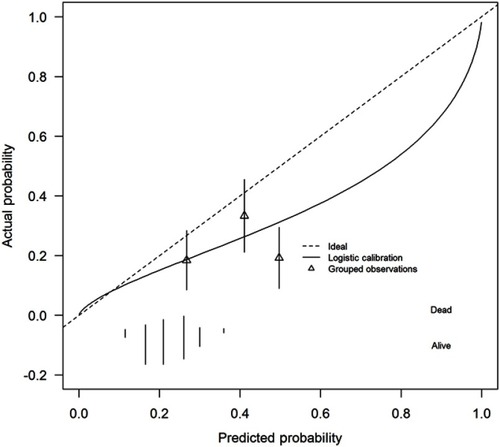
Figure 1 Model calibration – PREDICE.
Notes: Calibration plot: predicted outcome probabilities (on the x-axis) plotted against observed outcome frequencies (on the y-axis). Perfect predictions should be on the 45° line.
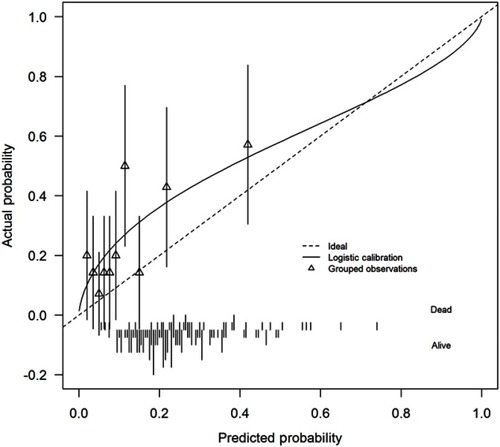
Figure 2 SCORE calibration – PREDICE.
Notes: Calibration plot: predicted outcome probabilities (on the x-axis) plotted against observed outcome frequencies (on the y-axis). Perfect predictions should be on the 45° line.
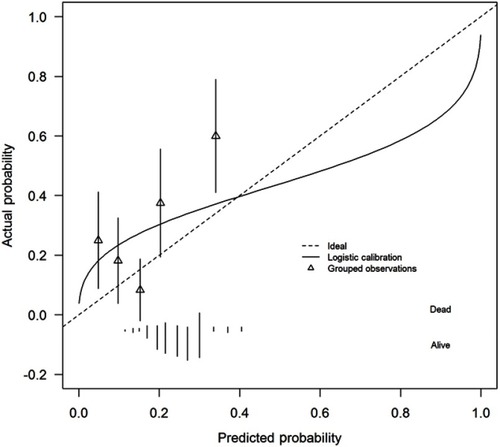
Figure 3 SCORE calibration – AHEAD (using the development cohort of PREDICE).
Notes: Calibration plot: predicted outcome probabilities (on the x-axis) plotted against observed outcome frequencies (on the y-axis). Perfect predictions should be on the 45° line.
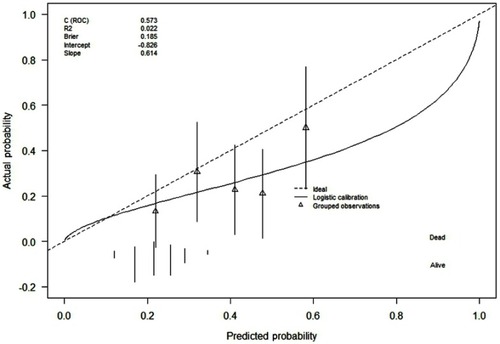
Figure 4 SCORE calibration – AHEAD (using the validation cohort of PREDICE).
Notes: Calibration plot: predicted outcome probabilities (on the x-axis) plotted against observed outcome frequencies (on the y-axis). Perfect predictions should be on the 45° line.