Figures & data
Figure 1 Age at diagnosis of pancreatic cancer patients in Central and Northern Denmark 1998–2009 by gender.
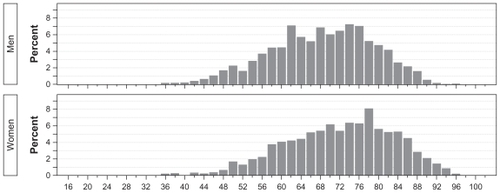
Table 1 Cumulative survival and crude and adjusted relative mortality (MRR) (and associated 95% confidence intervals) for pancreatic cancer patients diagnosed in Central and Northern Denmark, 1998–2009
Figure 2 Kaplan–Meier survival curves for patients with pancreatic cancer in Central and Northern Denmark regions, 1998–2009.
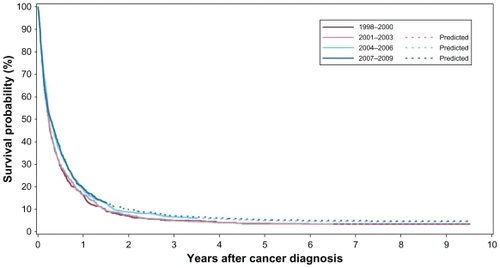
Table 2A Cumulative survival (and associated 95% confidence intervals) for male pancreatic cancer patients diagnosed in Central and Northern Denmark, 1998–2009
Table 2B Cumulative survival (and associated 95% confidence intervals) for female pancreatic cancer patients diagnosed in Central and Northern Denmark, 1998–2009
Table 3 30-day mortality and relative mortality (and associated 95% confidence intervals) among pancreatic cancer patients diagnosed in Central and Northern Denmark, 1998–2009