Figures & data
Figure 1 Age distribution at the time of diagnosis for men and women with kidney cancer in the period 1998–2009 in the central and the northern Denmark regions.
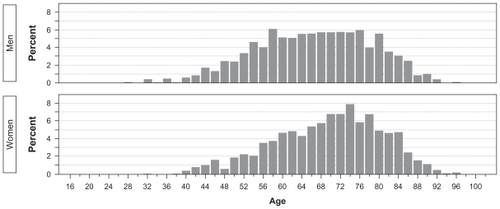
Figure 2 Overall survival of Danish kidney cancer patients diagnosed in the period 1998–2009 in the central and the northern Denmark regions.
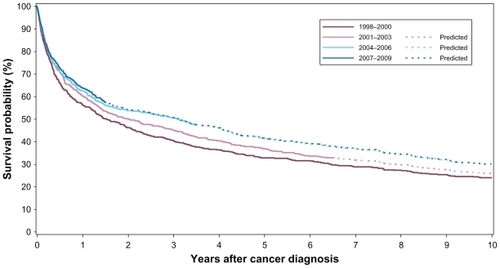
Table 1 One-, 3-, and 5-year crude cumulative survival and gender- and age-adjusted all-cause MRRs in Danish kidney cancer patients, 1998–2009
Table 2 One-, 3-, and 5-year survival and MRRs in Danish men with kidney cancer, 1998–2009, stratified by age group
Table 3 One-, 3-, and 5-year survival and MRRs in Danish women with kidney cancer, 1998–2009, stratified by age group
Table 4 Thirty-day mortality and MRR after nephrectomy in Danish patients with kidney cancer, 1998–2009