
Figures & data
Figure 1 PRISMA flow chart detailing literature searches and inclusion screening.
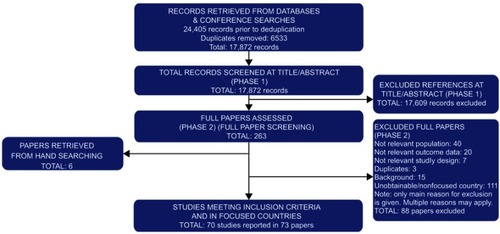
Figure 2 Summary of JBI risk of bias assessment for prevalence studies.
Abbreviations: JBI, Joanna Briggs Institute.
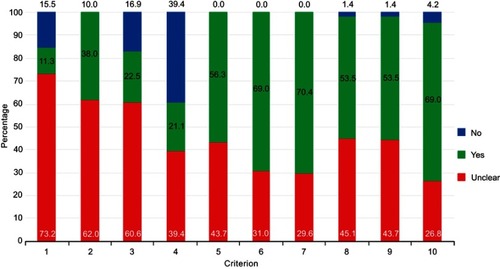
Table 1 Summary of key study characteristics
Figure 3 Prevalence (%) in largest (N>500) studies.
Notes: Horizontal axis has 3 levels: bottom – selection (family history/sex/ethnicity); middle – hormone receptor status (red = TNBC, dark green = mixed, light green = NR/unclear); top – country. BC stage not shown because NR/unclear for all but 2 studies (1 mixed and 1 invasive); *Bar for Son, 2012Citation37 is striped in order to distinguish it from bar for Kim, 2012: it is of mixed hormone receptor status.Citation26 Pale blue = germline reported; red text = deleterious/pathogenic/clinically significant reported. High risk: based on fulfilment of at least 1 of a set of criteria, including family history, early onset, or male BC, which vary by study (See ). Mixed: implies that the study included both those individuals with and without a family history of breast cancer, but the study did not report that probands were unselected.
Abbreviations: BC, breast cancer; NR, not reported; TNBC, triple-negative breast cancer.
Abbreviations: BC, breast cancer; NR, not reported; TNBC, triple-negative breast cancer.
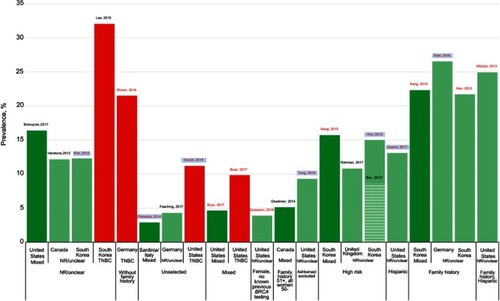
Table 2 Germline BRCA mutation prevalence in those unselected for family history, age, sex, or ethnicity
Table 3 BRCA mutation prevalence in advanced breast cancer