Figures & data
Figure 1 (A) Registries used to combine administrative, clinical, and outcome data. (B) Flowchart showing the selection of the study population.
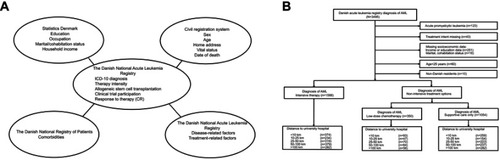
Table 1 Patient characteristics according to distance to nearest specialized treatment center in 2,992 adult AML patients
Table 2 Association between distances to nearest specialized treatment center and probability of intensive chemotherapy in 2,992 acute myeloid leukemia patients. Logistic regression analysis, crude, and adjusted estimatesa
Figure 2 Association between distances to the nearest specialized treatment center and mortality. Results of all AML patients by age and by treatment intensity. Cox regression analysis, crude, and adjusted estimates.a
Abbreviations: AML, acute myeloid leukemia; 95% CI, 95% confidence interval.
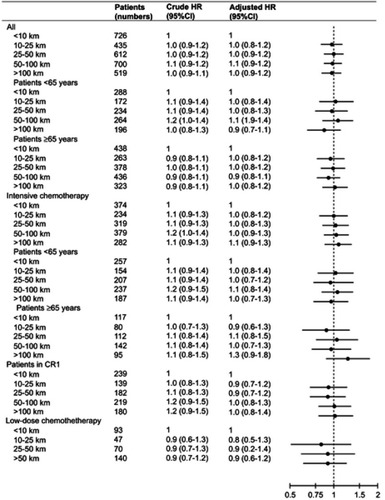
Table 3 Association between distances to nearest specialized treatment center and probability of CR in 1,463 AML patients treated with remission-induction therapy. Logistic regression analysis, crude, and adjusted estimatesa
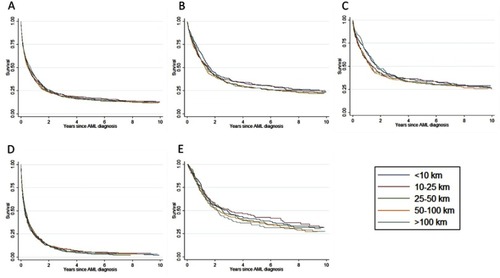
Figure 3 Crude survival according to categorical distance to the nearest specialized treatment center. Overall survival in all patients (A), in patients <65 years (B), in all patients ≥65 years (C), in all patients receiving intensive chemotherapy (D), and in all patients receiving intensive chemotherapy surviving to achieve a CR (E).