
Figures & data
Table 1 Summary of clinical dataa and survival estimates among patients with non-small cell lung cancer
Figure 1 Relative and cause-specific survival estimates by age group for patients with stage I (A), stage II (B), stage III (C), and stage IV (D) non-small cell lung cancer. The value in each box reports the percentage-point difference at 10 years since diagnosis (the 10-year cause-specific survival estimate minus the 10-year relative survival estimate).
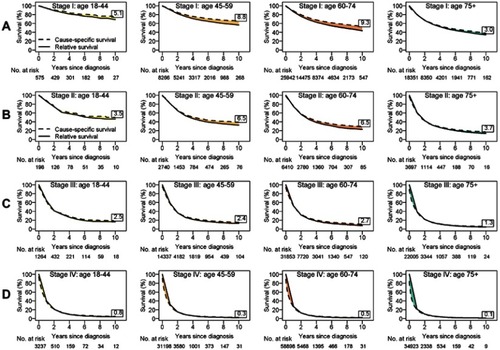
Figure 2 Relative and cause-specific survival estimates by age group for patients who underwent surgery with stage I (A), stage II (B), stage III (C), and stage IV (D) non-small cell lung cancer. The value in each box reports the percentage-point difference at 10 years since diagnosis (the 10-year cause-specific survival estimate minus the 10-year relative survival estimate).
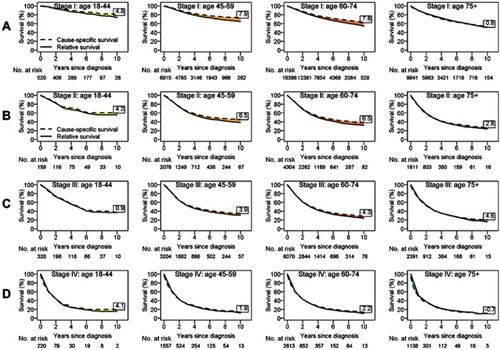
Table 2 Summary of clinical dataa and survival estimates among patients with non-small cell lung cancer who received surgery
Figure S1 Crude mortality from cancer and noncancer causes by age group for patients with stage I (A), stage II (B), stage III (C), and stage IV (D) non-small cell lung cancer. Cumulative incidence of lung-cancer deaths (LC-CID) and cumulative incidence of nonlung-cancer deaths (non-LC-CID) were generated using a competing risk approach. Overall, LC-CID increased with advancing age and stage; similarly, non-LC-CID increased with advancing age and stage. Even though the total number of deaths increased with age, the proportion of deaths attributable to cancer in the older age group decreased because of increased competing causes of death.
Abbreviation: Cum. incidence, cumulative incidence.
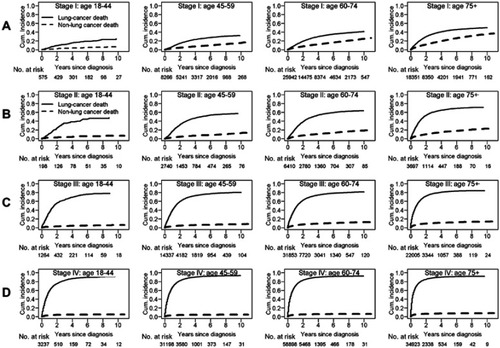
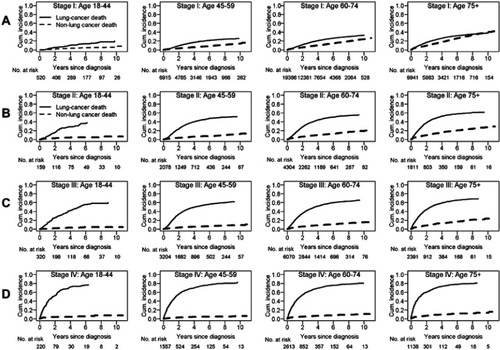
Figure S2 Crude mortality due to cancer and noncancer causes by age group for patients with stage I (A), stage II (B), stage III (C), and stage IV (D) non-small cell lung cancer among patients who underwent surgery.
Abbreviation: Cum. incidence, cumulative incidence.
Data availability
This paper utilized publicly available data through the Surveillance, Epidemiology, and End Results (SEER) program.