
Figures & data
Table 1 Patients with normal and abnormal scans by sex, age, comorbidity level, and cardiovascular morbidity
Table 2 Risk and hazard ratio of MI and all-cause death within 5 years following a normal versus abnormal scan, overall and according to comorbidity level
Table 3 30-day, 31−365-day, and 1−5-year risk of MI and all-cause death following a normal versus abnormal scan
Table 4 Risk and hazard ratio of MI registered during an acute admission within 5 years following a normal versus abnormal scan
Table 5 Risk and hazard ratio of MI and all-cause death within 5 years following a normal scan, a reversible defect, a fixed defect, and a combined defect. Included are patients with a first-time MI within 5 years before the scan
Figure 1 Estimated cumulative incidence of all-cause mortality risk among patients with normal and abnormal scans.
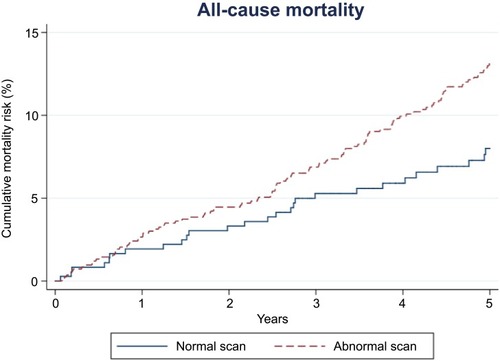
Table S1 Diagnosis codes according to the International Classification of Diseases, 8th (ICD-8) and 10th revision (ICD-10)
Table S2 Diagnosis codes for myocardial infarction according to the International Classification of Diseases, 8th (ICD-8) and 10th (ICD-10) revision
Table S3 Risk and hazard ratio of MI and all-cause death within 5 years following a normal versus abnormal scan
Table S4 Risk and hazard ratio of MI and all-cause death within 5 years following a normal versus abnormal scan.