
Figures & data
Table 1 Distribution of patient characteristics and lifestyle factors in patients with tinnitus and their matched controls
Figure 1 Age- and sex-specific crude incidence rates (IRs) of tinnitus first-time diagnoses in the United Kingdom from 2000 to 2016.
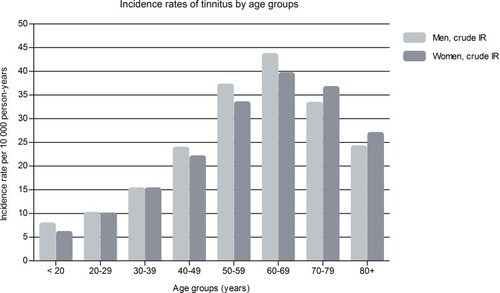
Figure 2 Sex-specific and age-standardised incidence rates (ASRs) of tinnitus first-time diagnoses in the United Kingdom from 2000 to 2016.
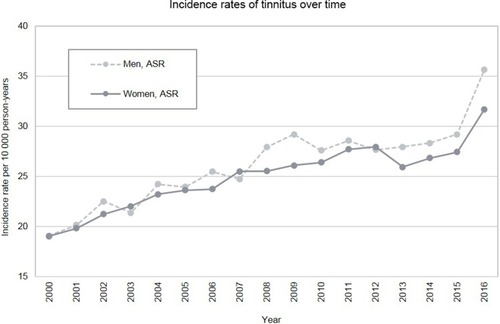
Table 2 Distribution of comorbidities in patients with tinnitus and their matched controls: internal diseases and neurological/psychological disorders
Table 3 Distribution of comorbidities in patients with tinnitus and their matched controls: otological and vestibular disorders
Table 4 Distribution of comorbidities in patients with tinnitus and their matched controls: head and neck disorders
Table S1 Incidence rates of tinnitus diagnosed in the UK between 2000 and 2016
Table S2 Distribution of patient characteristics and lifestyle factors in patients with tinnitus and their matched controls, stratified by sex
Table S3 Distribution of comorbidities in patients with tinnitus and their matched controls, stratified by sex: otological and vestibular disorders
Table S4 Distribution of comorbidities in patients with tinnitus and their matched controls, stratified by sex: head and neck disorders