Figures & data
Figure 1 Flowchart patient inclusion.
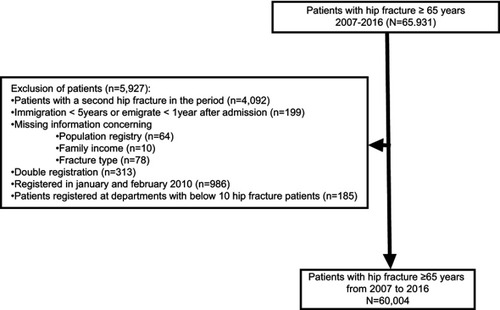
Table 1 Characteristic of the hip fracture population
Table 2 Variation in 30-day mortality
Figure 2 League table ranking the 32 hospitals according to their unadjusted absolute risk of 30-day mortality with 95 % confidence intervals obtained from a multilevel model.
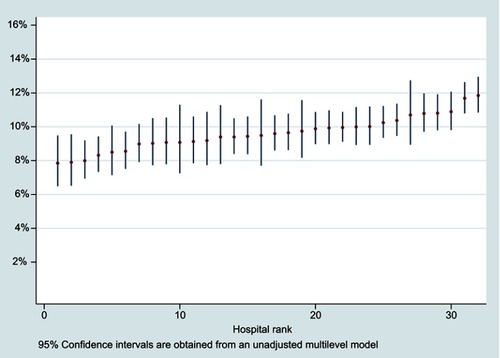
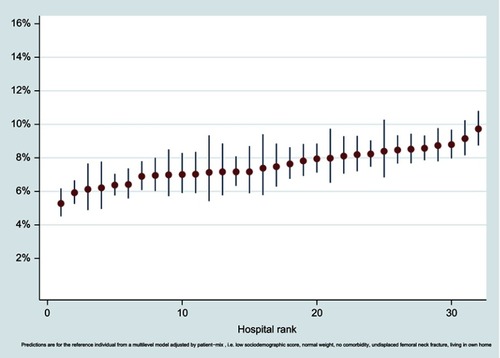
Figure 3 League table ranking the 32 hospitals according to their adjusted absolute risk of 30-day mortality with 95 % confidence intervals obtained from a multilevel model adjusted by patient-mix.