Figures & data
Table 2 Percentages of missing data among patients diagnosed before and after 2007
Table 1 Characteristics of 1,399 oral cavity squamous cell carcinoma patients diagnosed or treated at Rigshospitalet, University of Copenhagen, Denmark, in the period 2000–2014
Figure 1 Age-standardized incidence rates (ASIR) for patients with oral cavity squamous cell carcinoma diagnosed or treated at Rigshospitalet, University of Copenhagen, Denmark, in the period 2000–2014, stratified by sex (A) and anatomical sublocation (B).
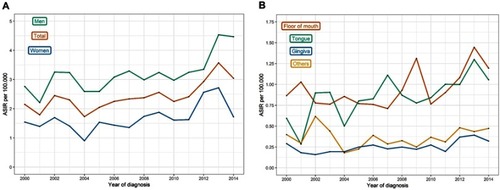
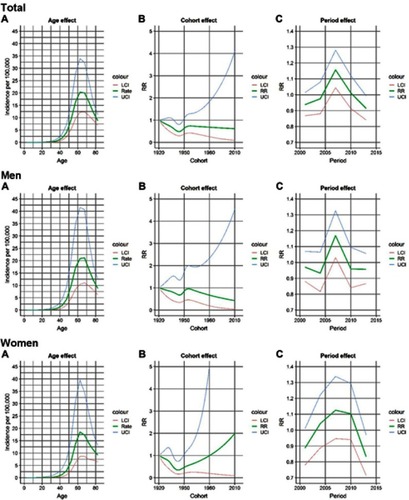
Figure 2 Age-period-cohort model for patients with oral cavity squamous cell carcinoma diagnosed or treated at Rigshospitalet, University of Copenhagen, Denmark, in the period 2000–2014. Panel A, B, and C show the age effect, the cohort effect, and the period effect separately. LCI: Lower confidence interval, UCI: Upper confidence interval.