
Figures & data
Table 1 Baseline Characteristics of the Study Cohort, N=1994 Initially Healthy Men
Table 2 Baseline Characteristics of the Study Cohort Stratified by Fasting Level of (A) Potassium and (B) Sodium (mmol/L) in Five Groups
Figure 1 Cumulative incidence of all-site cancer by levels of potassium and sodium. K≤3.5 is not present due to only one cancer event.
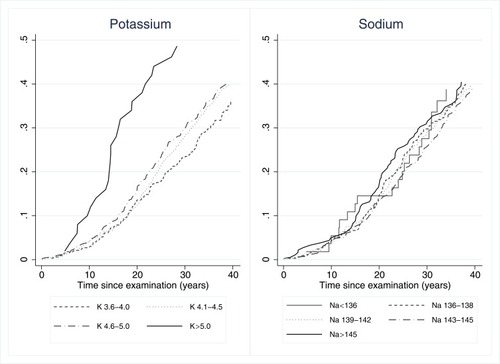
Table 3 Number of All-Site Cancer Cases (Events), Person-Years (Pyrs) and Age-Adjusted Incidence Rates (IR) with 95% Confidence Intervals (CI) Among Initially Healthy Men During 40 years of Follow-Up by Fasting Level of Potassium and Sodium at Baseline
Figure 2 Hazard ratio for all-site cancer by levels of potassium and sodium. Bars indicate 95% confidence intervals. Restricted cubic spline function of potassium and sodium with four knots chosen according to Harrell’s recommended percentiles. For potassium, the reference group was set to K=4.3 mmol/L. Estimates for values ≤3.2 and ≥5.4 were not presented due to low numbers. Dashed lines indicate the cut-off values for hypokalemia (≤3.5) and hyperkalemia (>5.0). For sodium, reference group was set to Na=140 mmol/L. Estimates for values ≤131 and ≥155 were not presented due to low numbers. Dashed lines indicate the cut-off values for hyponatremia (<136) and hypernatremia (>145).
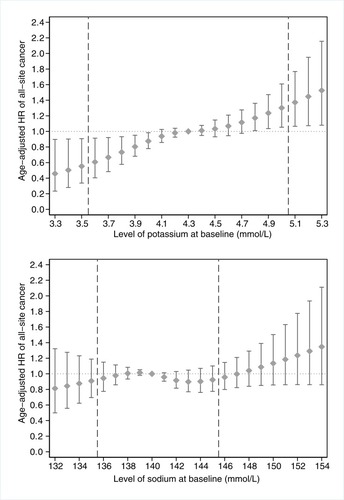
Table 4 Hazard Rate (HR) of All-Site Cancer Among Initially Healthy Men During 40 years of Follow-Up by Fasting Level of Potassium and Sodium at Baseline. The Standard Deviations (SD) for the Electrolytes Were 0.35 Mmol/L for Potassium and 3.5 mmol/L for Sodium
Table 5 Hazard Rates (HR) for the Most Frequent Cancer Sites in the Cohort of Initially Healthy Men Followed for 40 Years. The Standard Deviation (SD) for Potassium Was 0.35 mmol/L
Availability of Data and Material
Data are from the Oslo Ischemia Study. Public availability would compromise the privacy of the respondents. According to the approval from the Norwegian Regional committees for medical and health research ethics, the data is to be stored properly and in line with the Norwegian Law of privacy protection. Aggregated data are available on request.