
Figures & data
Figure 1 Flowchart of the study population after invitation to participate in the Puberty Cohort.
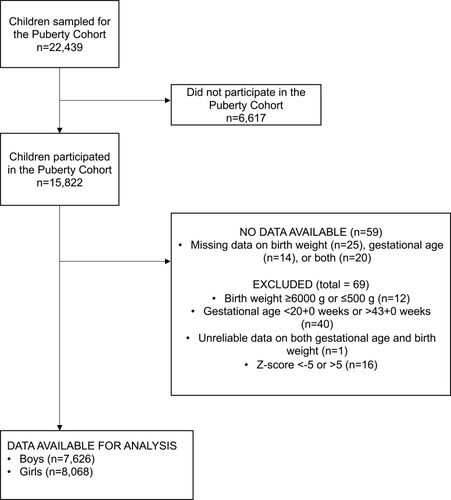
Table 1 Baseline characteristics of the children in the Puberty Cohort (N=15,694), Denmark, 2012–2017. Children are categorized as SGA, AGA, or LGA
Figure 2 Adjusted difference (with 95% CI) in reaching pubertal milestones when comparing SGA and LGA boys to boys born AGA.
Abbreviations: AGA, appropriate-for-gestational age; BMI, body mass index; LGA, large-for-gestational age; SGA, small-for-gestational age.
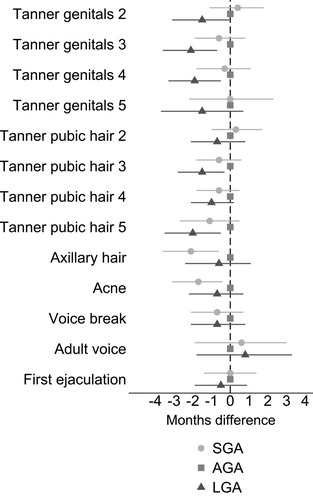
Figure 3 Adjusted difference (with 95% CI) in reaching pubertal milestones when comparing SGA and LGA girls to girls born AGA.
Abbreviations: AGA, appropriate-for-gestational age; BMI, body mass index; LGA, large-for-gestational age; SGA, small-for-gestational age.
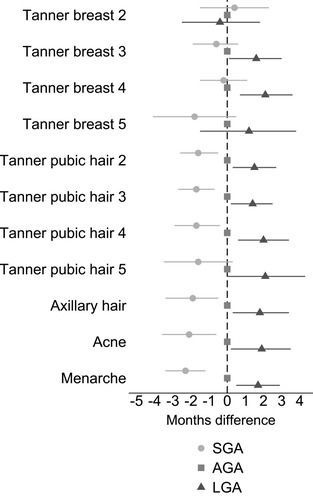
Table 2 Mean age difference (in months) at attaining pubertal milestone for each 1-unit increase in birth weight Z-score
Table 3 Mean age difference (in months) at attaining pubertal milestone for each 1-unit increase in Z-score during the periods from 0 to 5 months, 5 to 12 months, and 0 to 12 months
Data availability
The dataset analyzed in the study is not publicly available due to national data security legislation on sensitive personal data.