Figures & data
Figure 1 Flow chart of population selection.
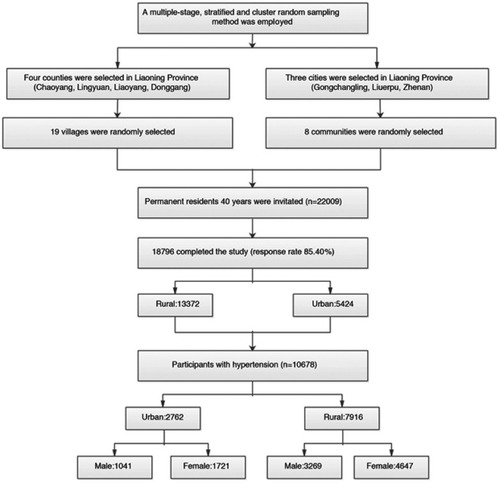
Table 1 Characteristics of the study participants
Figure 2 Prevalence of hypertension and prehypertension per 100 (with 95% CI) among urban and rural adults in northeast China by region and sex. (A) Prevalence of hypertension by region, (B) prevalence of prehypertension by region, (C) prevalence of hypertension by sex, (D) prevalence of prehypertension by sex.
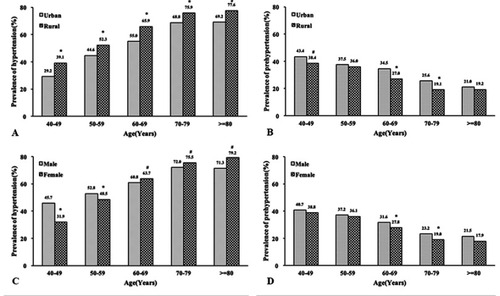
Table 2 Blood pressure level and prevalence of prehypertension, and hypertension by characteristics
Figure 3 Levels of systolic blood pressure and diastolic blood pressure in adults in urban and rural northeast China by region and sex. (A) By region, (B) by sex.
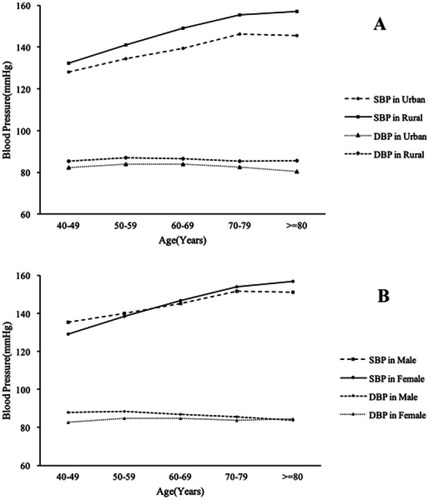
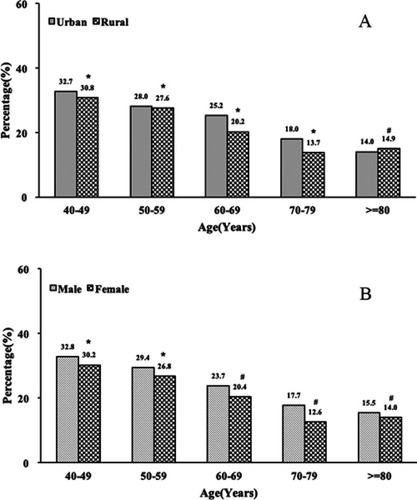
Figure 4 Awareness, treatment, and control rates among adults ≥40 years of northeast China by region. (A) Awareness rate by region, (B) treatment rate by region, (C) awareness rate by sex, (D) treatment rate by sex, (E) control rate by region, (F) control rate among treated hypertensive patients by region, (G) control rate by sex, (H) control rate among treated hypertensive patients by sex. #p<0.05, *p<0.001.

Table 3 Awareness, treatment, and control rates of hypertension by characteristics
Table 6 Prevalence and control rate according to 2010 Chinese high blood pressure guidelines and 2017 ACC/AHA high blood pressure guidelines
Table 4 Multivariable-adjusted odds ratio for prevalence of hypertension by region
Table 5 Multivariable-adjusted odds ratio for control rate of hypertension by region
Figure 5 The absolute differences in prevalence of hypertension according to 2010 Chinese guidelines for the management of hypertension to 2017 ACC/AHA high blood pressure guidelines by region (A) and sex (B). #p<0.05, *p<0.001.