
Figures & data
Figure 1 Flowchart of the Danish Blood Donor S. aureus Carriage Study cohort.
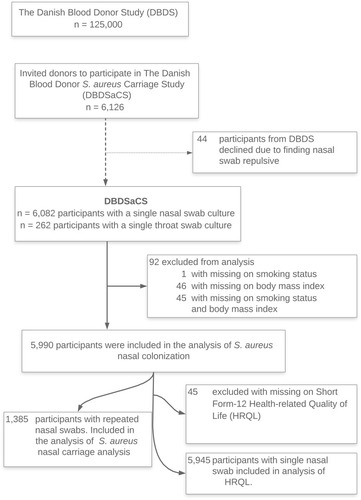
Table 1 Characteristics of the DBDSaCS cohort (n=6082) in comparison with the national blood donor cohort (n=234,836)
Figure 2 Bar chart illustrating the number of participants included by calendar month and their carrier status. Orange (or lower pillar) = S. aureus positive; Green (or upper pillar) = S. aureus negative.
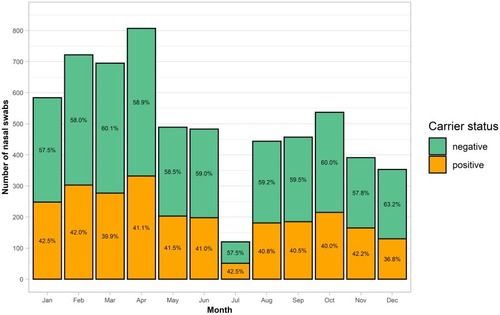
Table 2 Samples and data collected in DBDSaCS
Table 3 Characteristics of the DBDSaCS cohort by carrier status (n=6082)
Table 4 Characteristics of the DBDSaCS cohort by carrier status and stratified by sex (n=6082)
Table 5 Characteristics of participants sampled from the nose and using the two-step culture method (n=2217)
Table 6 Prevalence of throat and nasal colonization after primary culture and after enrichment (n=262)
Table 7 Predictors of Staphylococcus aureus colonization by log-binomial regression analysis (n=6082)a