
Figures & data
Table 1 Patients diagnosed with a VS in Denmark during the 40-year period 1976–2015
Figure 1 Annual number of diagnosed vestibular schwannomas in Denmark during the 40-year period 1976–2015. The Danish population was 5.1 million in 1976 and 5.7 million in 2015.
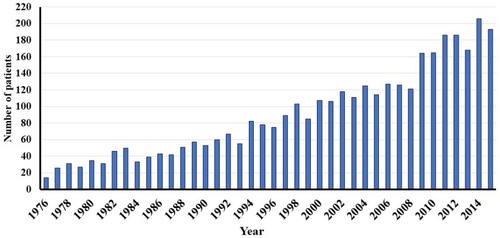
Figure 2 Mean tumor size at diagnosis over the 40-year period 1976–2015.
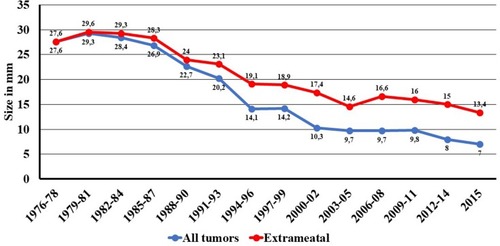
Figure 3 Proportions of different tumor size groups (in mm) over the 40-year period 1976–2015.
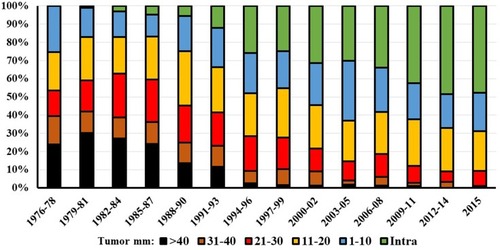
Figure 4 Median patient age at diagnosis over the 40-year period 1976–2015.
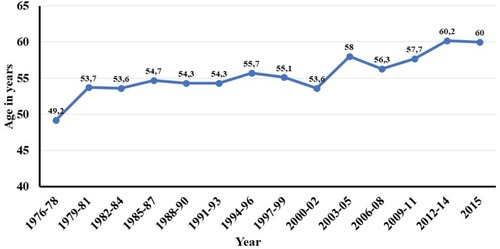
Figure 5 Proportions of different age groups over the 40-year period 1976–2015.
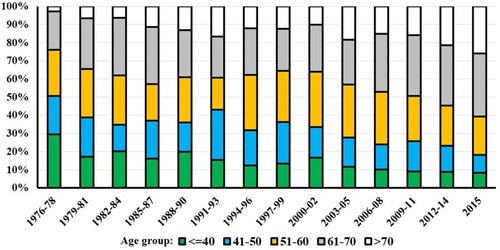
Table 2 Mean tumor size (mm extrameatal ±SD) related to age at diagnosis in patients diagnosed with a VS during the 40-year period 1976 – 2015