
Figures & data
Figure 1 PRISMA flow diagram of study selection.
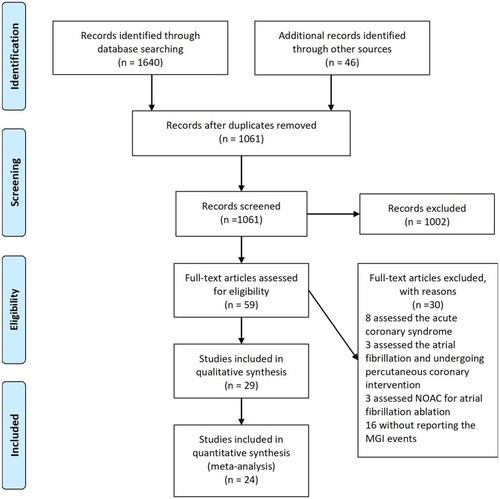
Figure 2 The network plot for the Bayesian meta-analysis.
Notes: Solid lines represent direct evidence, and dashed lines represent the indirect evidence. The size of the nodes corresponds to the number of patients receiving the regimen, and the width of the lines corresponds to the number of studies comparing the connected treatments.
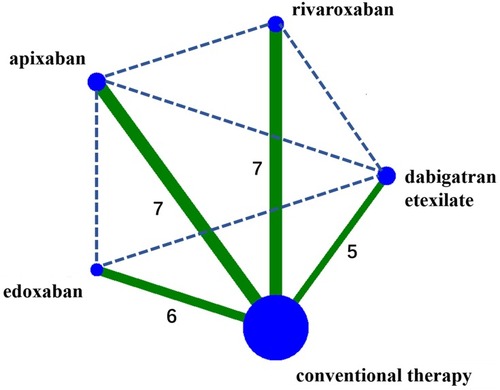
Table 1 The Characteristic Of The Included Studies
Figure 3 Results of the pairwise meta-analysis.
Notes: Forest plots illustrating the results of a meta-analysis. The calculated summary effect demonstrates the superiority of various NOACs compared with conventional therapy in reducing the risk of major gastrointestinal bleeding. Horizontal lines represent the 95% CI of the effect size; solid diamonds indicate the mean effect size in single studies; hollow diamond shapes depict the summary effect size (diamond center) and the relative 95% CI (lateral edges); the black vertical lines represent the reference “1” line.
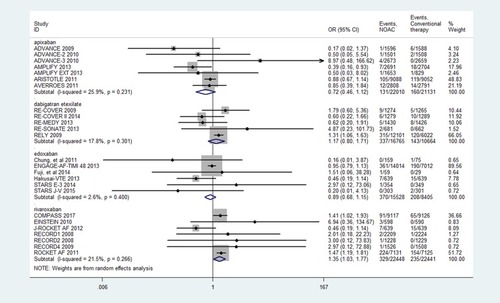
Figure 4 Meta-regression analysis of the effect of MGI bleeding event rate on the effect of fatal bleeding event rate.
Abbreviation: MGI, major gastrointestinal.
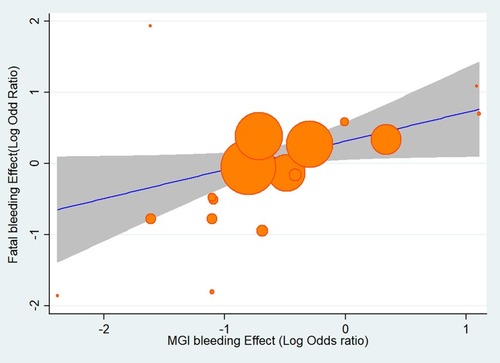
Table 2 Estimated Relative Treatment Effects As Odds Ratios (ORs) And Its Corresponding 95% Credibility Intervals (CrIs)
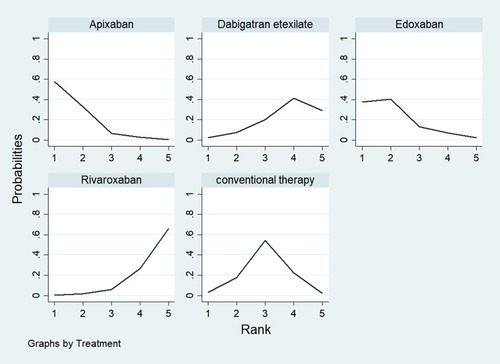
Figure 5 Graph showing probability ranking of each NOAC regimen for the risk of MGI bleeding.
Note: Rank 1 is best and rank 5 is worst.
Availability of data and materials
All data generated or analyzed during this study are included in this article and its additional files.