
Figures & data
Table 1 Characteristics of Minnesota Heart Survey Primary Prevention Population, 1985 to 2009. Age Range Restricted to 40–79 Years, and to Those Eligible for PCE Calculationa
Table 2 Description of mPCE and ePCE
Figure 1 Measured PCE 10-year CVD risk (mPCE) by knowledge of risk and age group within women and men.
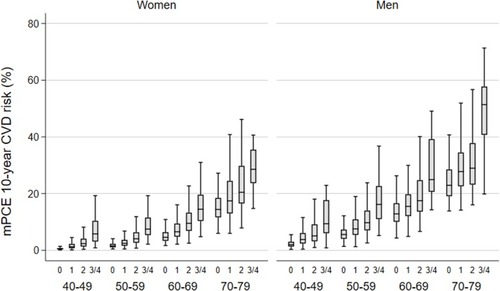
Figure 2 Estimated vs measured PCE 10-year CVD risk in women (left) and men (right). Values are only shown for those with mPCE<40.
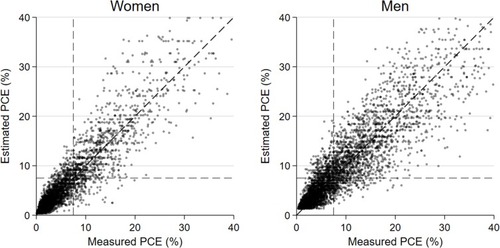
Figure 3 Calibration of the internal validation model, with line of identity denoting perfect calibration in women (left) and men (right). Risk is plotted at deciles of mPCE and ePCE.
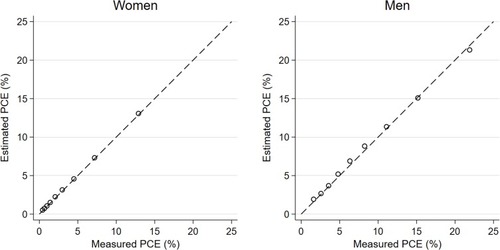
Table 3 Measured (mPCE) and Estimated PCE (ePCE), Stratified by Age Group and Knowledge of Risk (Represented as the Sum of Risk Factors): Minnesota Heart Survey Primary Prevention Population, 1985 to 2009. Knowledge of Risk factors (KoR) are Hypertension, Hypercholesterolemia, Diabetes, and Smoking