
Figures & data
Table 1 Baseline Characteristics by Incident Dyslipidemia Status
Figure 1 Kaplan-Meier survival estimates with shaded 95% confidence band comparing male with female participants.
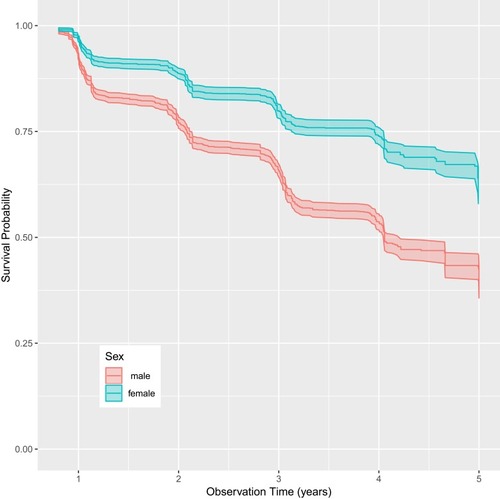
Figure 2 Prediction error of RSF and VIMP values of each variable in males and females. (A and C) depict the prediction error rates for ensemble cumulative hazard function in males and females. (B and D) show the VIMP values for males and females.
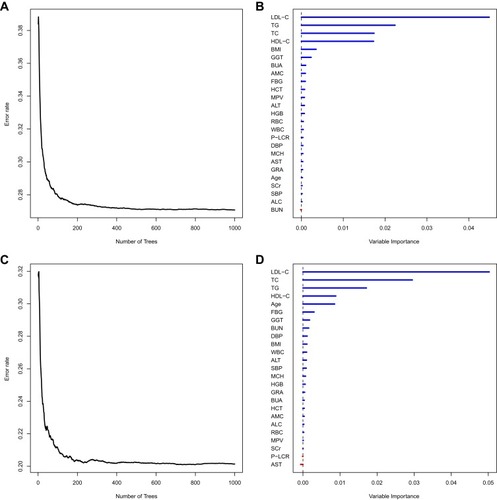
Figure 3 Partial plots of the top four predictors including the partial values (red points) 2 SE (dashed red lines).
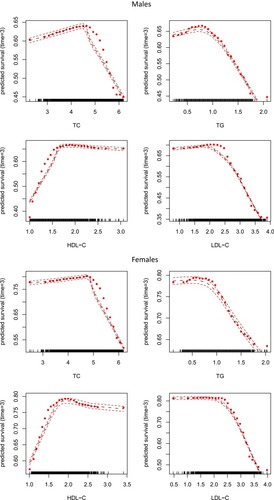
Table 2 Cox Proportional Hazard Model for Predicting Dyslipidemia in Males and Females
Table 3 C-Statistics for Prediction Model with RSF and CPH Model in Males and Females