
Figures & data
Figure 1 A flow chart of the patient allocation in an RCT of PPOS versus GnRHa-long protocol.
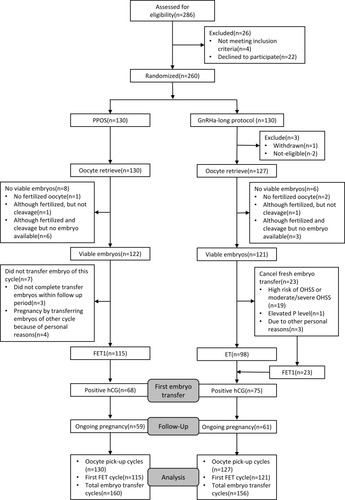
Figure 2 Concentrations of FSH, LH, E2, and P in the two groups during controlled ovarian stimulation. Abbreviations: FSH, follicle-stimulating hormone; LH, luteinizing hormone; E2estrogen; P, progesterone.
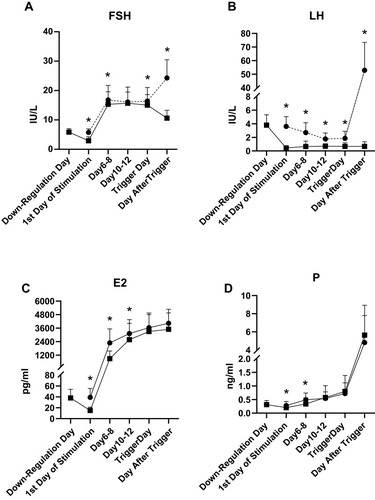
Table 1 The Basic Characteristics of Women Undergoing IVF/ICSI Treatment in the Two Ovarian Stimulation Groups
Table 2 The Cycle Characteristics of Controlled Ovarian Stimulation in Two Regimens
Table 3 The Embryological Outcomes of Controlled Ovarian Stimulation in Two Regimens
Table 4 Hormone Profiles During Ovarian Stimulation in the Two Groups
Table 5 Pregnancy Outcomes of the First ET/FET Cycles Originating from the Two Regimens
Table 6 Pregnancy Outcomes of the First FET Cycles Originating from the Two Groups