Figures & data
Table 1 Characteristics of the Population (n=129,900)
Table 2 Bayesian Information Criterion (BIC) for Latent Models with 7–11 Classes
Table 3 Mean Conditional Probabilities of the 22 Chronic Conditions from the Three Datasets Within the Eight Classes in the LCA Model, Including Class Size and Expected Number of Chronic Conditions for Women (n=68,687)
Table 4 Mean Conditional Probabilities of the 22 Chronic Conditions from the Three Datasets Within the Eight Classes in the LCA Model, Including Class Size and Expected Number of Chronic Conditions for Men (n=61,213)
Figure 1 Age-adjusted odds ratios for differences in healthcare utilization the last year before an acute hospitalization between patients in the eight multimorbid patterns for women.
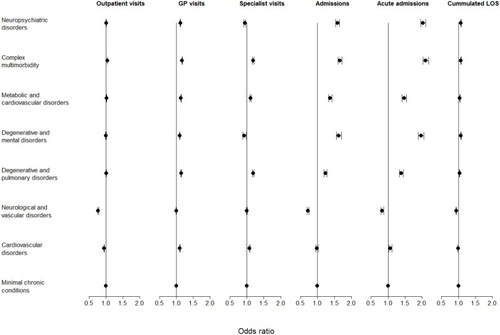
Figure 2 Age-adjusted odds ratios for differences in healthcare utilization the last year before an acute hospitalization between patients in the eight multimorbid patterns for men.
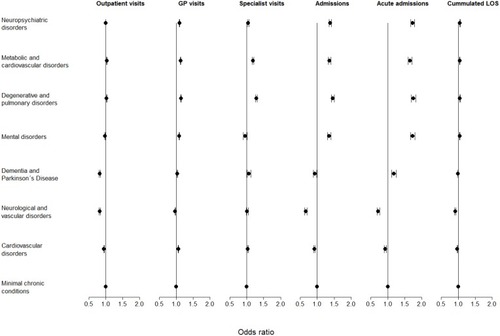
Figure 3 Age-adjusted odds ratios for differences in healthcare complexity the last year before an acute hospitalization between patients in the eight multimorbid patterns.
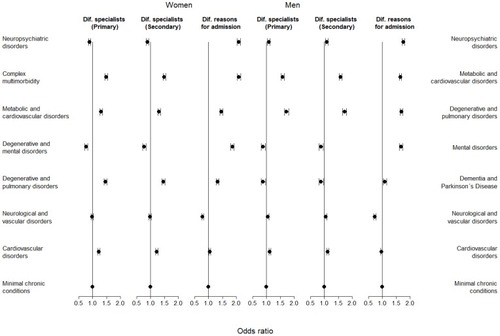
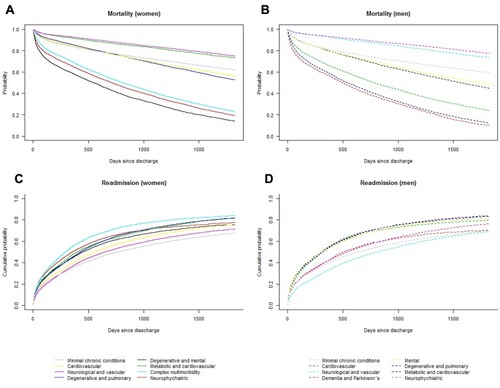
Figure 4 Survival plot of time to event for all-cause mortality within 5 years from discharge for women (A) and men (B) and cumulative incidence plot for time to event for readmission within 5 years from discharge for women (C) and men (D) according to the eight multimorbid patterns adjusted for age.