
Figures & data
Table 1 Estimates for Intervention Effects and 95% CIs Obtained Using Segmented Regression (SR), Pooled Analysis (PA), and Weighted Segmented Regression (wSR)
Figure 1 Forest plot for change in level of mobilization during the implementation of the intervention compared to the pre-intervention period.
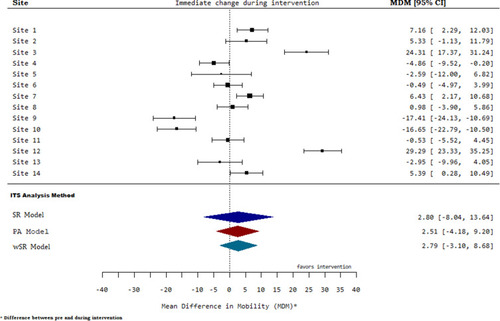
Figure 2 Forest plot for change in trend of mobilization during the implementation of the intervention compared to the pre-intervention period.
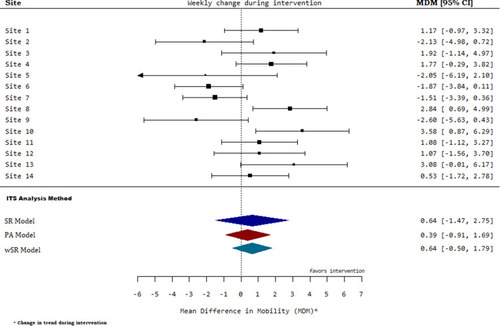
Figure 3 Forest plot for change in level of mobilization after the implementation of the intervention compared to the pre-intervention period.
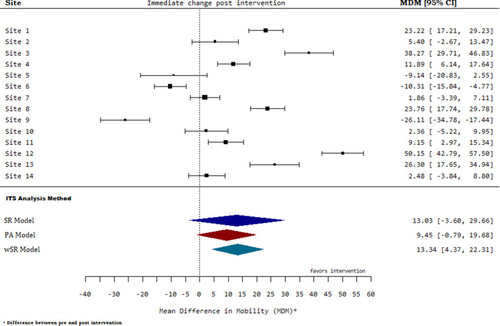
Figure 4 Forest plot for change in level of mobilization post intervention for high between-site heterogeneity.
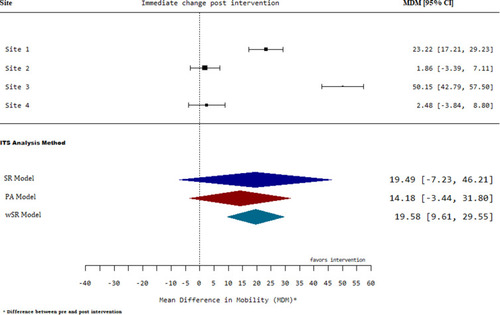
Figure 5 Forest plot for change in level of mobilization during intervention for moderate between-site heterogeneity.
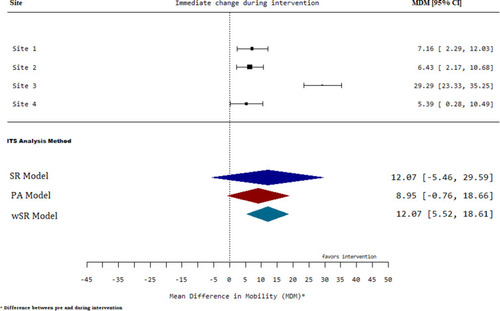
Figure 6 Forest plot for change in trend of mobilization during intervention for moderate between- and within-site heterogeneity.
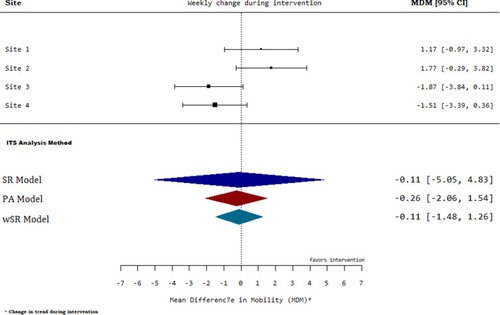
Figure 7 Forest plot for change in trend of mobilization post intervention for low between-site heterogeneity.
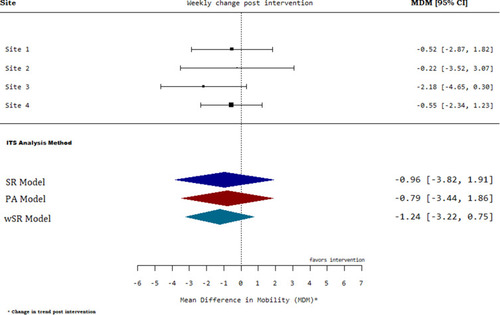
Figure 8 Forest plot for change in level of mobilization post intervention for low within- and between-site heterogeneity.
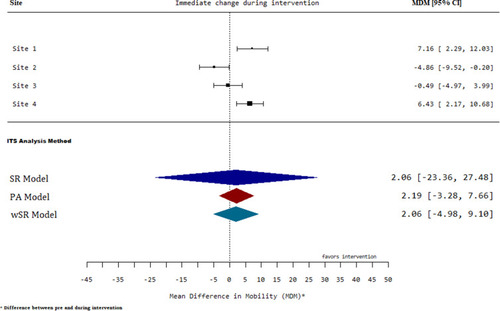
Figure 9 Forest plot for change in level of mobilization post intervention for moderate within- and between-site heterogeneity.
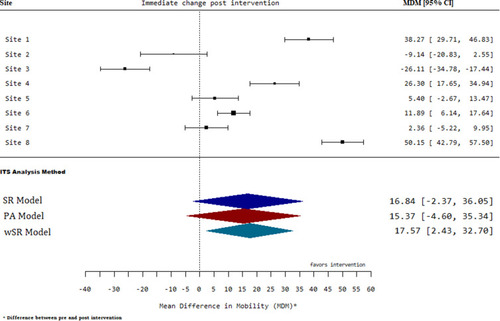
Figure 10 Forest plot for change in trend of mobilization post intervention for high within-site variability.
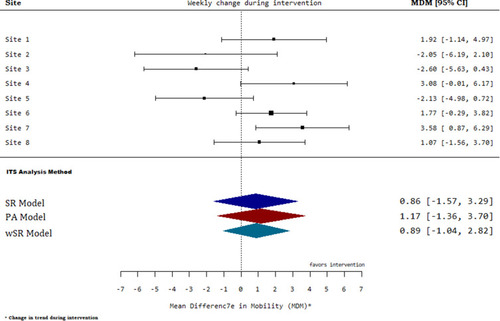
Table 2 Subgroup Estimates for Intervention Effects and 95% CIs Obtained Using Segmented Regression (SR), Pooled Analysis, and Weighted Segmented Regression (wSR)