
Figures & data
Figure 1 PRISMA flow diagram.
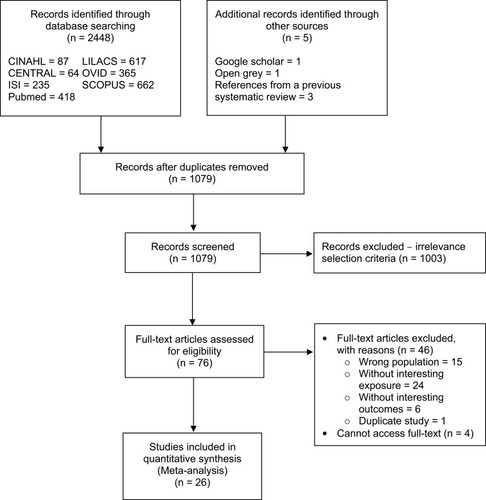
Figure 2 Risk of bias assessment using the Newcastle-Ottawa Scale for cohort (left; 24 studies) and case-control studies (right; two studies).
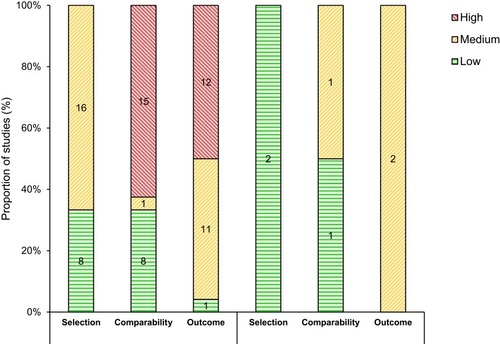
Figure 3 Meta-analysis of associations between previous cesarean delivery and perioperative complications in subsequent hysterectomy.
Abbreviations: k, number of studies; n, number reported outcomes; OR, odds ratio; previous CS, previous cesarean section;  , sampling variance; , variance between reported outcomes from the same study; , variance between studies; NA, not applicable.
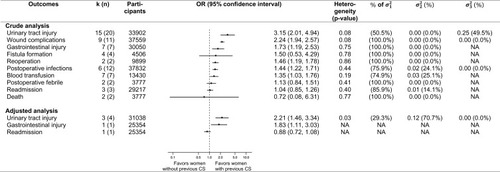
Figure 4 Meta-analysis of associations between previous cesarean delivery and perioperative complications in subsequent hysterectomy according to the study design.
Abbreviations: k, number of studies; n, number reported outcomes; OR, odds ratio; previous CS, previous cesarean section; , sampling variance; , variance between reported outcomes from the same study; , variance between studies; NA, not applicable.
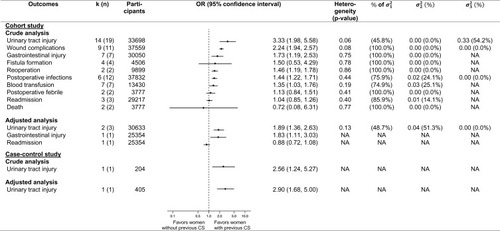
Table 1 Subgroup Analysis According to Routes of Operation
Table 2 Sensitivity Analysis by Excluded High Risk of Bias Studies