Figures & data
Table 1 Risk Factors and Comorbidities in Screened General Population Men Across Decades: Prevalence in All Attenders and Attenders with a Positive Test for Abdominal Aortic Aneurysm
Table 2 Association Between Smoking Status (%) and AAA
Figure 1 Five-year cumulative aneurysmal repair for men with screen-detected abdominal aortic aneurysm in the 1990s versus the 2000s (Age adj. HR = 1.29, 95% C.I.: 0.95; 1.71, p=0.10).
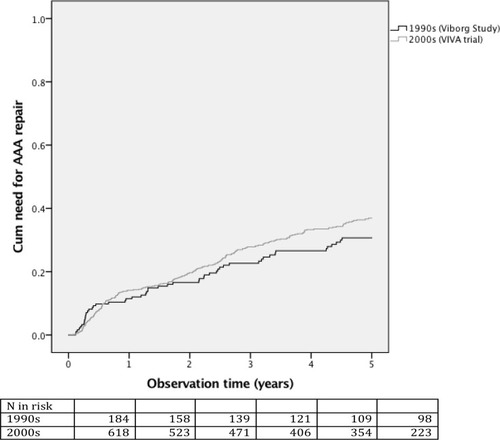
Table 3 Age-Stratified Prevalence of Abdominal Aortic Aneurysms (n and %) and Overall Time Trends Across Decades (Odds Ratios with 95% Confidence Intervals)
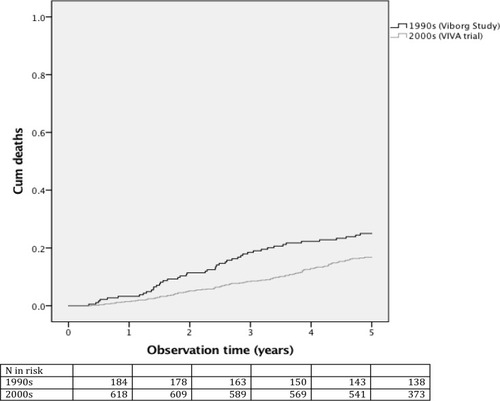
Figure 2 Five-year mortality of men detected with abdominal aortic aneurysm in the 1990s versus the 2000s regarding overall mortality (Age-adjusted HR= 0.277, 95% C.I.: 0.215; 0.356, p<0.001).