
Figures & data
Figure 1 Number of mirabegron initiations per quarter year between January 2013 and December 2016 per country. Total number of initiations are shown for the pre-DHPC period, the DHPC intervention month (September 2015), and for the post-DHPC period.
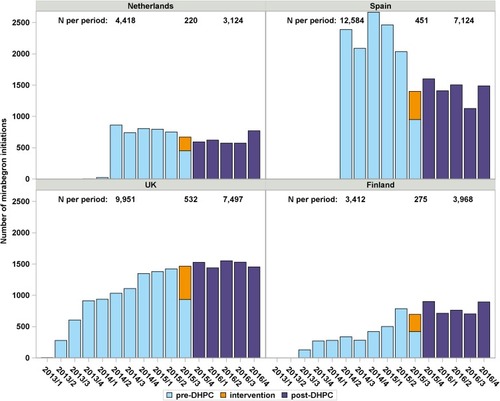
Figure 2 Observed, predicted and counterfactual proportions of patients with severe or non-severe uncontrolled hypertension at mirabegron initiation, by country. EAC = Estimated absolute change, i.e. projected counterfactual proportion – predicted proportion based on the best fit model at mid-point of post-DPHC period (denoted with dashed vertical lines). The DHPC intervention month is denoted with solid vertical lines.
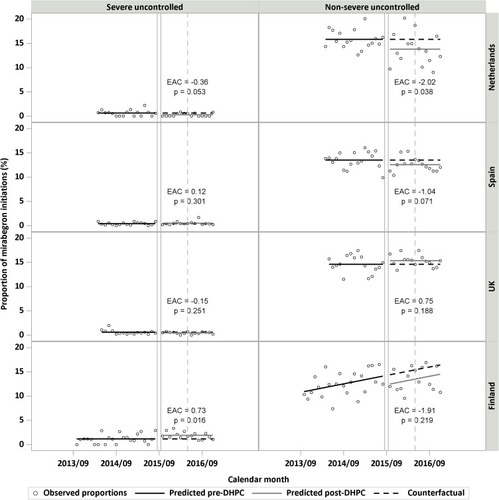
Table 1 Patient Characteristics
Table 2 Proportion of Mirabegron Initiations with Severe and Non-Severe Uncontrolled Hypertension Relative to DHPC Dissemination
Table 3 Frequency of Blood Pressure Recordings Before and During Mirabegron Treatment