
Figures & data
Figure 1 Flow chart of survey participants and maternal safety outcome.
Abbreviation: MNM, maternal near-miss.
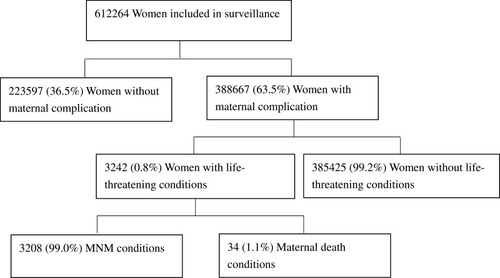
Table 1 Frequency of Organ Dysfunction Related to Pregnancy Among 3208 MNM During 2012–2017
Table 2 The Difference of Demographic and Obstetric History and Delivery Mode Characteristics of Women with and Without MNM
Table 3 Comparison of the Frequency of Potentially Life-Threatening Disorder and Other Complications Between Women with MNM and Without
Table 4 Comparison of Perinatal Outcome Between Women with MNM and Without During 2012–2017
Table 5 Risk Factors for MNM in Zhejiang Province During 2012–2017