Figures & data
Figure 1 Flowchart of participant enrollment.
Abbreviation: NHSE, National Health Screening Examination; NHSP-IC, National Health Screening Program for Infants and Children.
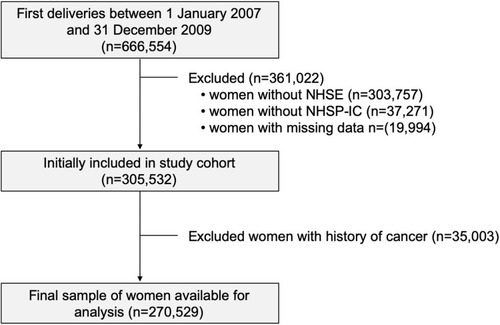
Table 1 Clinical Characteristics of Participants Stratified by Transfusion Status
Table 2 Risk of the Development of Cancer According to Transfusion Status
Table 3 Risk of the Development of Specific Cancer Types Based on Transfusion Status
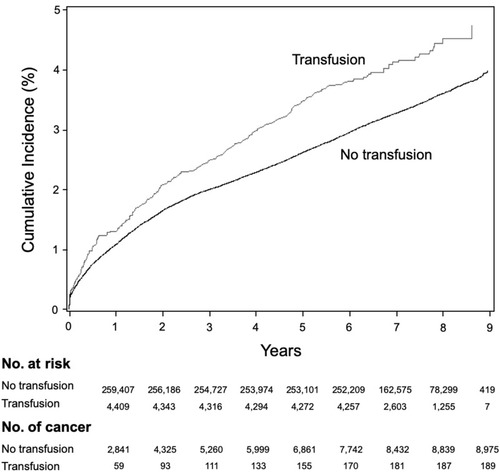
Figure 2 Cumulative incidence of cancer diagnoses. The incidence of cumulative cancer incidence is illustrated for transfusion recipients and non-recipients over a 9-year span. The greater incidence in cancer diagnoses among transfusion recipients remained persistent during this time, suggesting that this difference was not due to occult malignancies that predisposed those patients to requiring transfusions.