
Figures & data
Figure 1 PRISMA study flow diagram. Adapted from Moher D, Liberati A, Tetzlaff J, Altman DG, The PRISMA Group (2009) Preferred Reporting Items for Systematic Reviews and Meta-Analyses: The PRISMA Statement. PLoS Med 6(7): e1000097. Creative Commons license and disclaimer available from: http://creativecommons.org/licenses/by/4.0/legalcode.Citation22
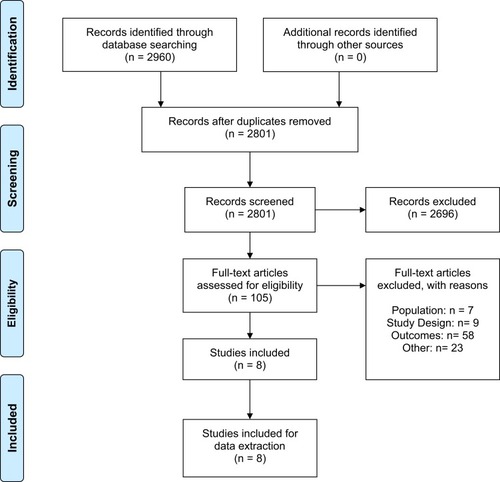
Table 1 Design Characteristics of Studies Examining Incidence and Prevalence of Atypical Hemolytic Uremic Syndrome
Table 2 Baseline Population Characteristics of Studies Examining Incidence and Prevalence of Atypical Hemolytic Uremic Syndrome
Figure 2 Studies reporting countries with reported incidence estimates by age group.
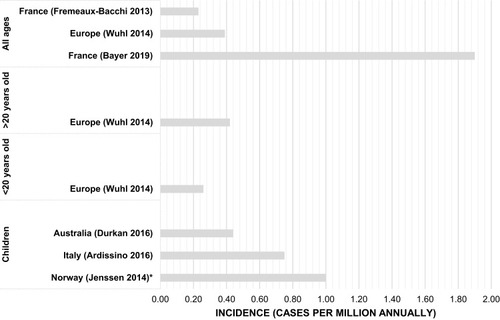
Figure 3 Studies reporting countries with reported prevalence estimates by age group.
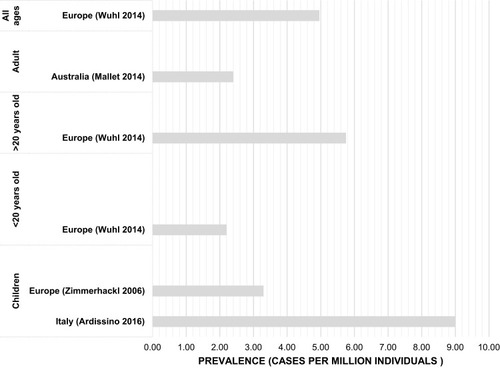
Table 3 Incidence and Prevalence of Atypical Hemolytic Uremic Syndrome