Figures & data
Table 1 Characteristics of Patients with Congenital Hemolytic Disorders in Denmark, 2000–2016
Table 2 Prevalence of Congenital Hemolytic Disorders in Denmark in 2000, 2007 and 2015
Figure 1 Prevalence of alpha thalassemic disorders in Denmark, 2000–2016, according to models for classification of diagnoses (main model vs sensitivity model). The overall prevalence with 95% confidence intervals for alpha thalassemic diseases calculated on 1 January each year with census data as denominator. The 95% confidence intervals are calculated using the Clopper–Pearson method. Alpha-Thalassemia trait and HbH disease w not defined in the sensitivity model they do not have a separate ICD 8 or 10 code.
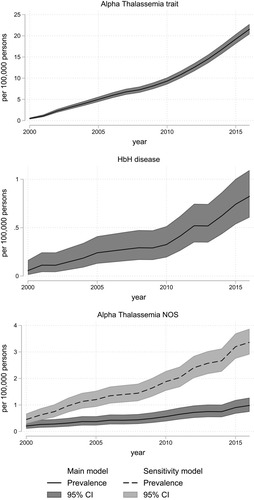
Figure 2 Prevalence of beta thalassemic disorders in Denmark, 2000–2016, according to models for classification of diagnoses (main model vs sensitivity model). The overall prevalence with 95% confidence intervals for beta-thalassemic diseases calculated on 1 January each year with census data as denominator. The 95% confidence intervals are calculated using the Clopper–Pearson method.
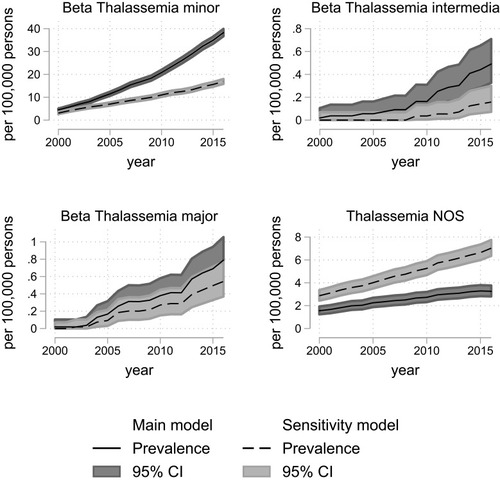
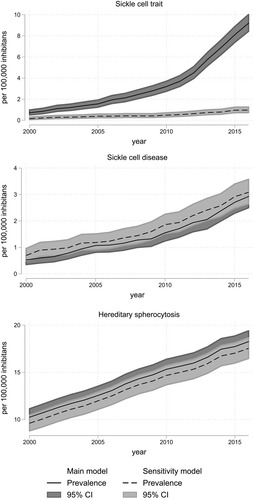
Figure 3 Prevalence of sickle cell disorders and hereditary spherocytosis in Denmark, 2000–2016, according to models for classification of diagnoses (main model vs sensitivity model). The overall prevalence with 95% confidence intervals for sickle cell disorders and hereditary spherocytosis calculated on 1 January each year with census data as denominator. The 95% confidence intervals are calculated using the Clopper–Pearson method.