
Figures & data
Figure 1 Flowchart of study population.
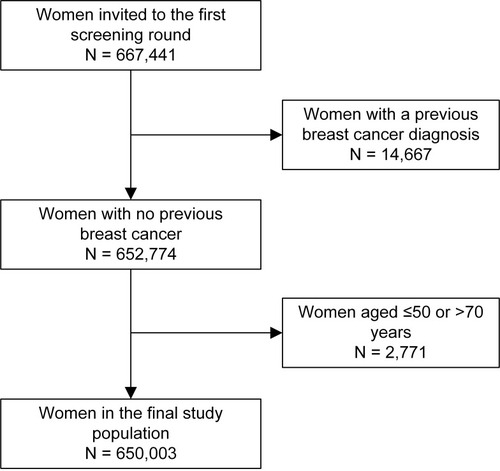
Table 1 Included Diagnosis with ICD-10 Code in Charlson Comorbidity Index (CCI) According to Their Respective Weight
Table 2 The Distribution of Participants and Non-Participants Stratified by Age Group, Region, and Charlson Comorbidity Index (CCI). N= 650,003
Table 3 Prevalence Proportion Ratio (PR) of Screening by Age Group, Region, and Charlson Comorbidity Index (CCI). N= 650,003
Table 4 Unadjusted and Adjusted Prevalence Proportion Ratios (PR) for Participation by Selected Diseases and Years Since Diagnosis, Using No Disease as the Reference. Diseases are Separated by Charlson Comorbidity Index (CCI) Weight. N=650,003