
Figures & data
Figure 1 Causal directed acyclic graph (cDAG) for the effect of smoking and breast cancer. Minimally sufficient adjustment set included age, alcohol, education, physical activity and socioeconomic status (SES).
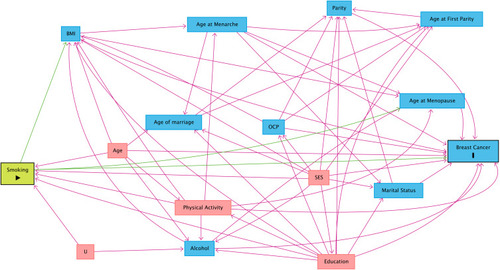
Figure 2 LOWESS (A) and fractional polynomial plot (B) for the association between age and breast cancer.
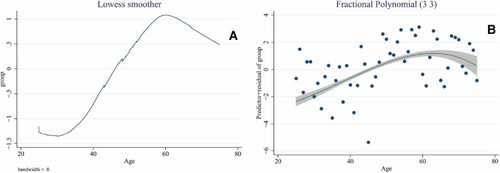
Table 1 The Probability Distributions Parameters for Triangular, Beta and Logistic Distributions in Case and Control Groups
Table 2 Characteristics of Cases and Controls
Figure 3 The distribution of ORs adjusted for measurement bias and confounding, assuming non-differential (A, B and C) and differential (D, E and F) misclassification errors. The distribution of bias parameter was assumed to be triangular (A and D), beta (B and E) and logistic (C and F).
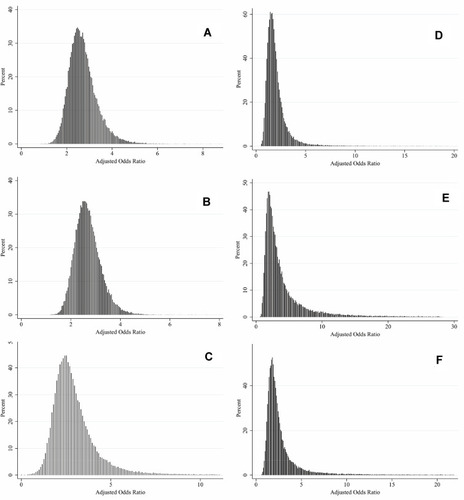
Table 3 Adjusted Odds Ratio with 95% Confidence Interval or MCSA Interval Using Conventional and Probabilistic Bias Analyses.
Table 4 The Estimates of Population Attributable Fraction with 95% Confidence Intervals or MCSA Intervals Using Conventional and Bias Analyses
Table 5 E-Values for Alcohol Consumption Assuming No Adjustment Was Made for the Variable