Figures & data
Table 1 Characteristics of Matching Variables and Covariates for Cases and Controls
Figure 1 Mean yearly GP contacts and the ratio of the adjusted IRR from prior to vaccination compared to after vaccination between cases and matched controls (entire study population). Cases: 1,458; Controls: 7,212. ** Date of vaccination included.
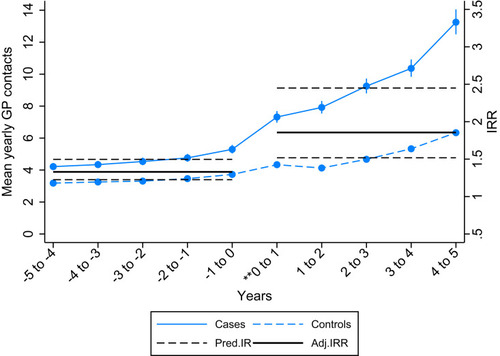
Table 2 Mean Yearly GP Contacts, the Incidence Rate Ratios (IRR) of Mean Yearly GP Contacts, and the Ratio of the Adjusted IRR from Prior to Vaccination Compared to After Vaccination Between Cases and Matched Controlsa
Figure 2 Mean yearly GP contacts and the ratio of the adjusted IRR from prior to vaccination compared to after vaccination between cases and matched controls. (A) 2008–2009. Cases: 497; Controls: 2,477. (B) 2010–2012. Cases: 637; Controls: 3,162. (C) 2013–2015. Cases: 324; Controls: 1,573. **Date of vaccination included.
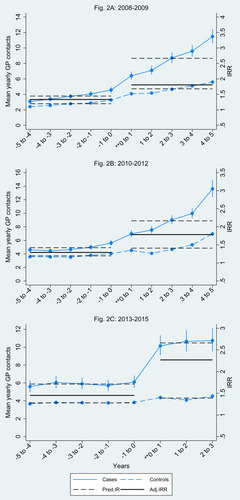
Figure 3 Mean yearly GP contacts and the ratio of the adjusted IRR from prior to vaccination compared to after vaccination between cases and matched controls. (A) Under 15 years. Cases: 973; Controls: 4,852. (B) Above 15 years. Cases: 485; Controls: 2,360. **Date of vaccination included.
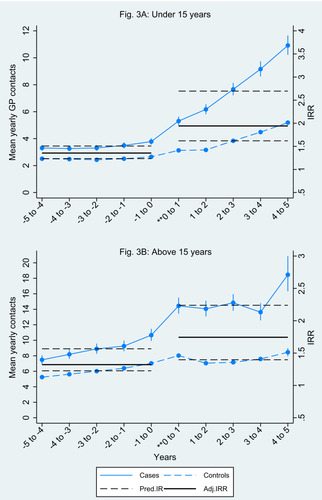
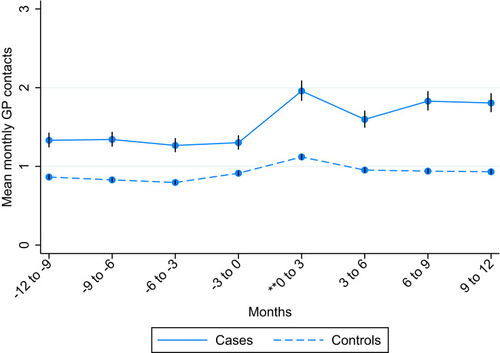
Figure 4 Mean monthly GP contacts 12 months prior to and 12 months following vaccination divided into three months intervals (entire study population). Cases: 1,458; Controls: 7,212. **Date of vaccination included.