Figures & data
Table 1 Characteristics of Patients with HSV-1 and HSV-2 in Cerebrospinal Fluid, and Their Corresponding Comparison Cohorts, Denmark, 2000–2016
Figure 1 Survival in persons with herpes simplex virus (HSV) type 1 and type 2 central nervous system (CNS) infection (full lines) and in members of the comparison cohorts (broken lines). (A) Survival after HSV-1 CNS infection. (B) Survival after HSV-2 CNS infection. (C) Survival after HSV-2 CNS infection in persons without a prior diagnosis of cancer.
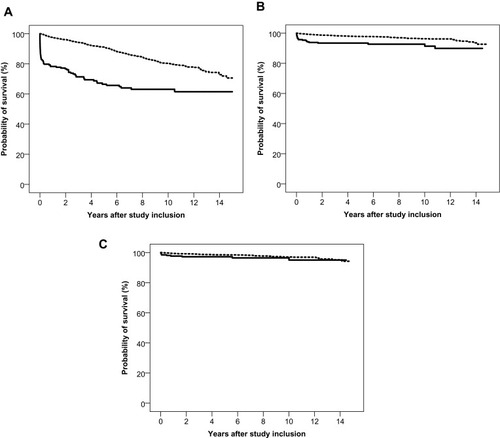
Table 2 Mortality Rate Ratios (MRRs) and Incidence Rate Ratios (IRRs) for Cancer and Dementia Diagnoses in Patients with HSV-1 and HSV-2 in Cerebrospinal Fluid Compared with Members of the Matched Comparison Cohorts
Table 3 Hospitalization Inpatient Days, Number of Outpatient Visits, Proportion Visiting a Department of Neurology, Proportion with a Hospital Visit Associated with Epilepsy, Employment Status, Sick Leave, Proportion Receiving Disability Pension, and Marital Status Among Patients with HSV-1 or HSV-2 in Cerebrospinal Fluid and Members of the Comparison Cohorts
Figure 2 Proportion on disability pension* among patients with herpes simplex virus (HSV) type 1 and type 2 central nervous system infections (black) and members of the comparison cohorts (white) by years before and after study inclusion. (A) HSV-1 CNS infection. (B) HSV-2 CNS infection.
Note: *Among individuals aged 20–60 years at study inclusion.
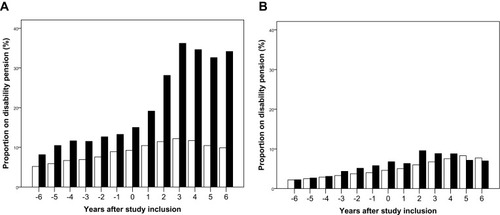
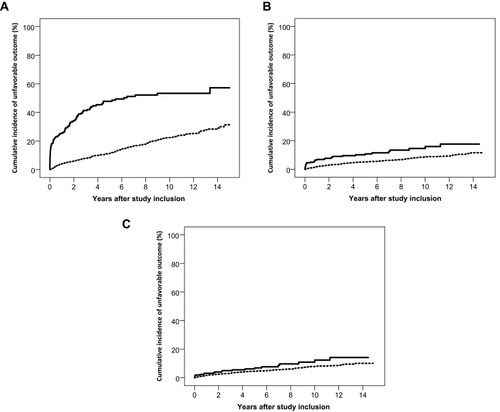
Figure 3 Cumulative incidence of an unfavorable outcome (death, dementia, receipt of a disability pension, and nursing home residency) in patients with herpes simplex virus (HSV) type 1 and type 2 central nervous system (CNS) infections (full lines) and members of the comparison cohorts (broken lines). (A) Unfavorable outcome after HSV-1 CNS infection. (B) Unfavorable outcome after HSV-2 CNS infection. (C) Unfavorable outcome after HSV-2 CNS infection in persons without a prior diagnosis of cancer.