
Figures & data
Table 1 Completeness and Positive Predictive Value (PPV) of Registrations in DaRenCaData Compared to Registrations in DCR
Figure 1 (A) Relative survival for two nationwide renal cell carcinoma registries. Kaplan-Meier curves showing the outcomes for patients registered in DaRenCaData and Danish Cancer Registry. (B) Relative survival based on registry registration. Kaplan-Meier curves showing survival of patients found in both registries (intersection) with DaRenCaData’s date of diagnosis, or with DCR’s date of diagnosis, registration in DaRenCaData only (DaRenCa set difference) and registration in Danish Cancer Registry only (DCR set difference).
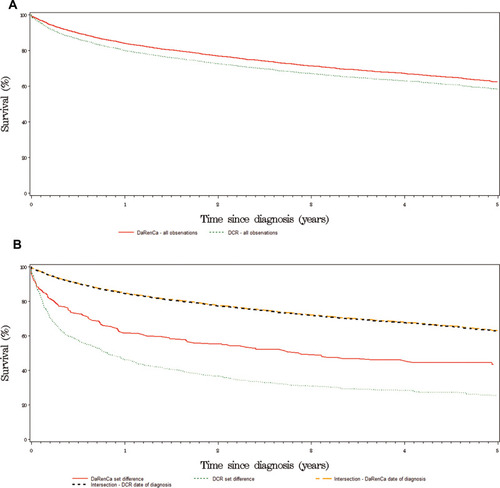
Table 2 Relative Survival Based on Registry Registration for DCR and DaRenCaData Patient Populations (Model 1), and Relative Survival for Patients in the Intersection (with Either DCR or DaRenCaData Date of Diagnosis as Entry Point), or Only Registered in DCR or DaRenCaData (Model 2)
Table 3 Mortality Rate Ratios for DCR and DaRenCa Patient Populations (Model 1), and Mortality Rate Ratios for Patients in the Intersection (with Either DCR or DaRenCa Date of Diagnosis as Entry Point), or Only Registered in DCR or DaRenCaData (Model 2)
Table 4 1-Year Mortality Rate Ratios with Time Variations for Patients Registered in Both DCR and DaRenCaData (Model 2)