
Figures & data
Figure 1 Selection of cohort of persons with newly identified CKD stages 3–5 and no prevalent anemia.
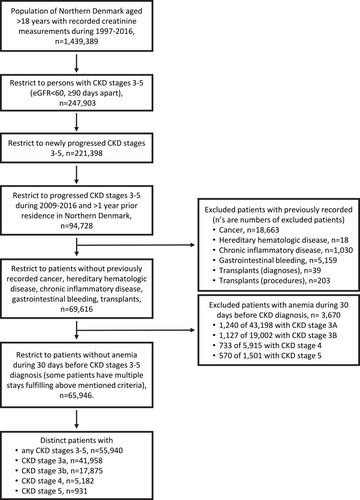
Table 1 Characteristics of 55,940 Patients with Newly Identified CKD Stages 3–5, Northern Denmark, 2009–2016
Table 2 Risk aIncidence Rate (per 100 Person-Years), and Hazard Ratio of Newly Measured Anemia in Patients with Newly Identified CKD Stages 3–5, Northern Denmark, 2009–2016
Figure 2 Cumulative risk of developing any anemia (Panel (A) and anemia of varying severity (Panels B–D), according to newly identified CKD stage: any CKD (grey curve), stage 3a (blue curve), 3b (green curve), stage 4 (yellow curve), stage 5 (red curve).
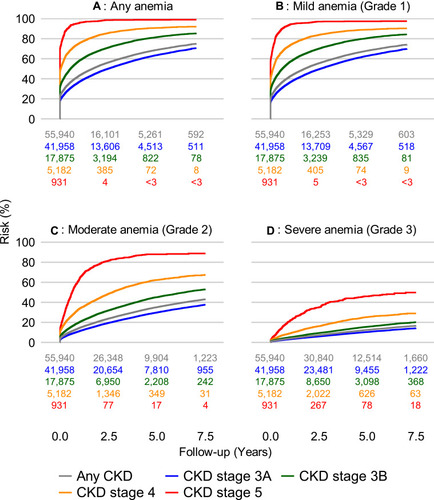
Table 3 Risk of Newly Measured Anemia in Patients with Any Newly Identified CKD Stages 3–5, Stratified by Sex, Age, and Comorbidity on the Index Date, Northern Denmark, 2009–2016