Figures & data
Figure 1 Study flow chart. Inclusion and exclusion criteria were applied to 15,607,733 patients in the MarketScan® and Medicare Supplemental claims databases to select the four study cohorts.
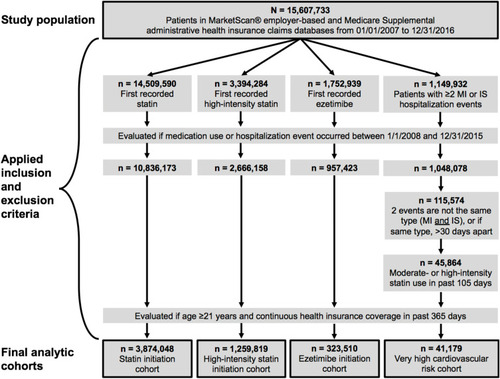
Table 1 Characteristics of Study Cohort Patients Using All Available Data Leading Up to and Including the Date of the Index Event (Medication Initiation or CVD Hospitalization Event)
Figure 2 LDL-C testing rates (with 95% CI) per 1,000 persons per calendar year quarter from 2008 to 2016, by study cohort. The unadjusted observed rates are plotted in black; the time-series model fit to the pre-guideline data is plotted in blue; and the model predictions extrapolated to the post-guideline period are plotted in red. The dashed line corresponds to the date of the guideline change, and the quarter during which the guideline change occurred (10/01/2013–12/31/2013) was treated as the last pre-guideline quarter.
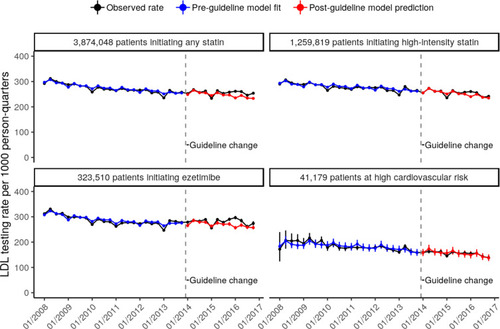
Figure 3 Differences between observed rates and model-predicted rates of LDL-C tests per 1,000 persons per calendar year quarter, by study cohort. Differences were taken by subtracting the model-predicted rate from the observed rate for each calendar year quarter following the guideline change.
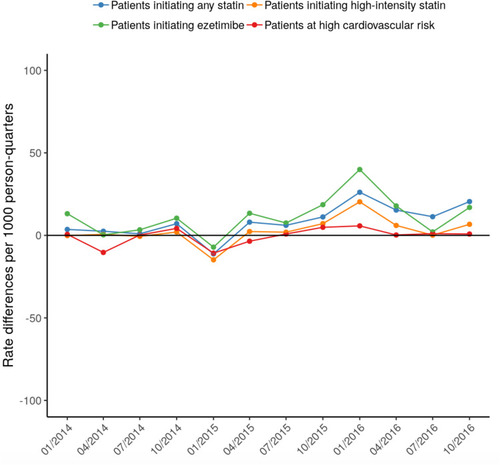
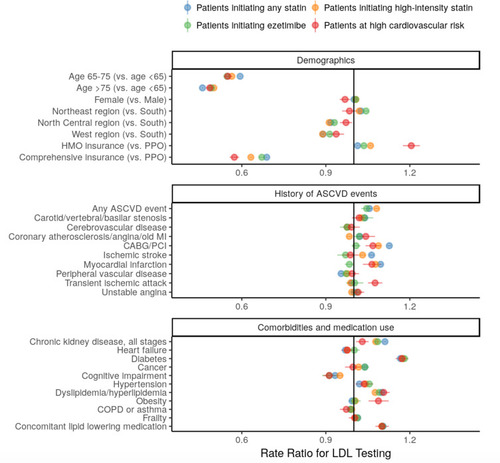
Figure 4 Rate ratios (with 95% CI) for LDL-C testing associated with predictor variables. Predictors included demographics, history of ASCVD events, comorbidities and medication use. Their association with LDL-C testing (following index event) was estimated separately by study cohort and was not computed if prevalence of the predictor was <1%.