Figures & data
Table 1 Vital Status at 10 Years, Age, Sex, and TNM Cancer Stage at Cancer Diagnosis Among Colorectal Cancer Patients in Granada, Between 2011 and 2013, n = 3,589
Table 2 Ten-Year Overall Mortality Rate and Mortality Rate Ratios by Sociodemographic Characteristics, TNM Cancer Stage at Diagnosis, and Quintiles of Deprivation Among Colorectal Cancer Patients in Granada, Between 2011 and 2013, n = 3,589
Table 3 Excess Mortality Risk by Deprivation Quintiles Adjusted for Sex, Age, TNM Cancer Stage at Diagnosis, and Census Tract Area in Granada, Between 2011 and 2013, n = 3,404
Figure 1 Relative survival probability, restricted mean survival time, and restricted mean survival time differences in years by levels of deprivation (Q5 vs Q1) among colorectal cancer patients in Granada, between 2011–2013, n = 3582.
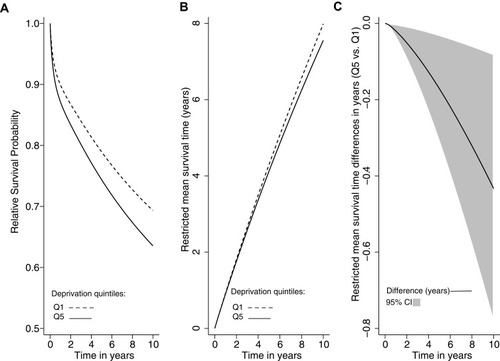
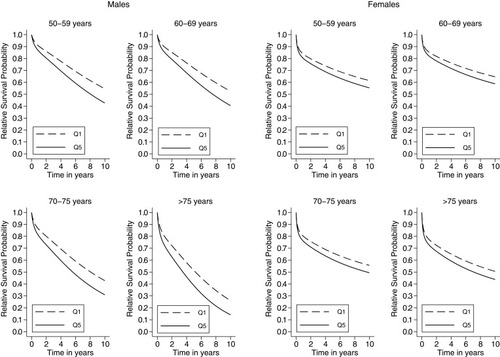
Figure 2 Sex-specific relative survival probability by deprivation (Q5 vs Q1) and age at cancer diagnosis among colorectal cancer patients in Granada, between 2011–2013, n = 3,582.