
Figures & data
Figure 1 Flowchart of this study.
Abbreviation: CO, carbon monoxide.
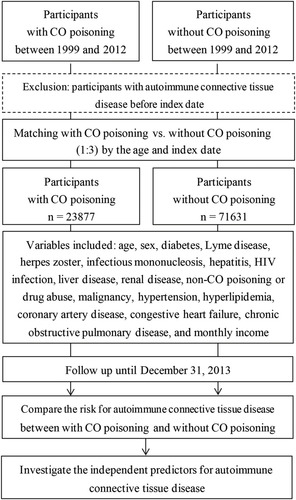
Table 1 Age, Sex, Underlying Comorbidities, and Monthly Income in Participants with and without CO Poisoning
Figure 2 Comparison of the risk of autoimmune connective tissue disease between participants with and without CO poisoning during follow-up by Kaplan–Meier’s method and the Log rank test.
Abbreviation: CO, carbon monoxide.
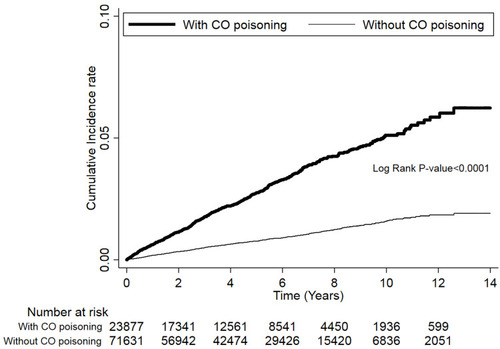
Table 2 Comparison of the Risk for Autoimmune Connective Tissue Disease Between Participants with and without CO Poisoning Using Cox Proportional Hazard Regression Analysis
Table 3 Independent Predictors for Autoimmune Connective Tissue Disease in the All Participants by Cox Proportional Hazard Regression Analysis