Figures & data
Figure 1 PRISMA flow diagram of study selection.21
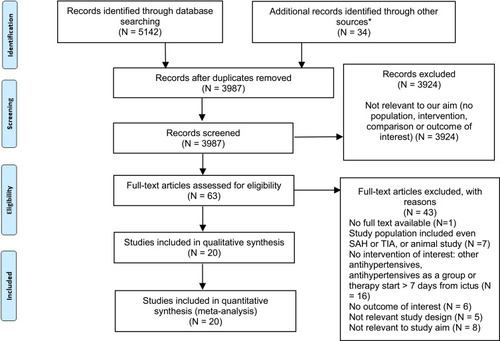
Figure 2 Forest plot analyzing the association between beta-blocker treatment and post-stroke mortality, presenting adjusted (for stroke severity and age) rate ratio (RR) and 95% confidence interval (CI).
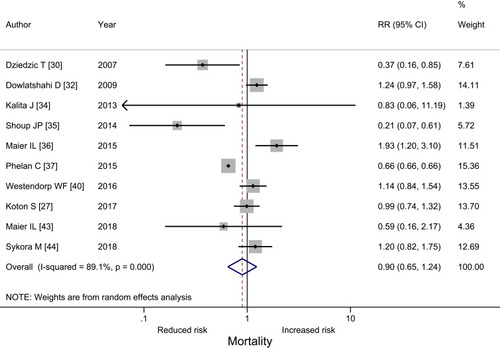
Figure 3 Forest plot analyzing the association between beta-blocker treatment and post-stroke mortality, presenting rate ratio (RR) and 95% confidence interval (CI). For study author with *, crude RR was used.
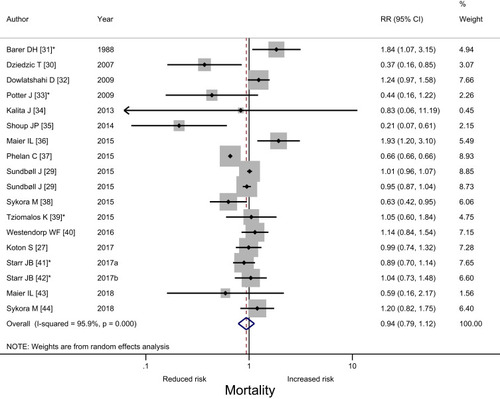
Figure 4 Forest plot analyzing the association between beta-blocker treatment and functional outcome after an acute stroke, presenting adjusted (for stroke severity and age) odds ratio (OR) and 95% confidence interval (CI).
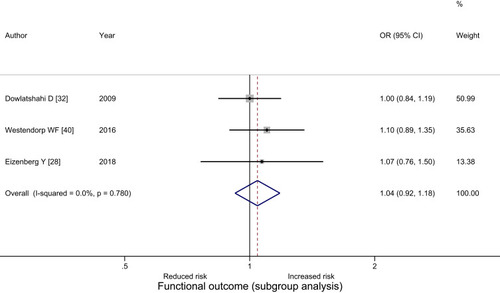
Figure 5 Forest plot analyzing the association between beta-blocker treatment and functional outcome after stroke, presenting odds ratio (OR) and 95% confidence interval (CI). For studies with *, crude OR was used.
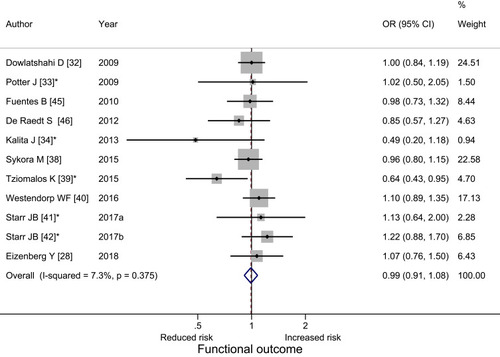
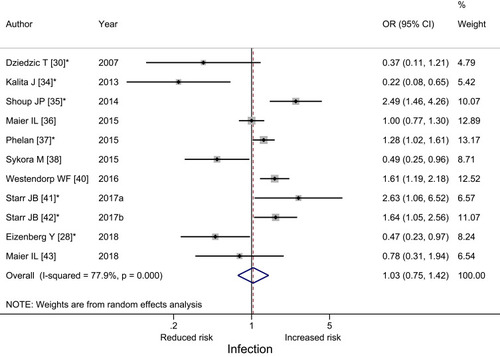
Figure 6 Forest plot analyzing the association between beta-blocker treatment and post-stroke infections, presenting adjusted (for stroke severity and age) odds ratio (OR) and 95% confidence interval (CI).
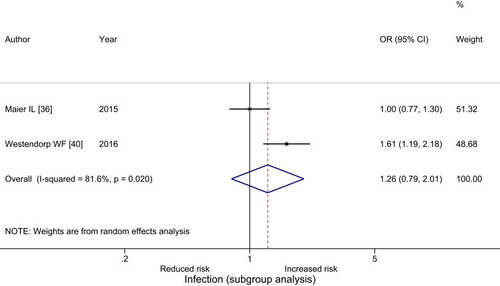
Figure 7 Forest plot analyzing the association between beta-blocker treatment and post-stroke infections, presenting odds ratio (OR) and 95% confidence interval (CI). For study author with *, crude OR was used.