
Figures & data
Table 1 Pregnancy Episodes Identified by the Pregnancy Identification Algorithm (PIA)
Figure 1 Secular trend of pregnancies among women of child-bearing age stratified by live, mixed, and unclassified deliveries (A) and non-live outcomes (B).
Notes: The numerator is the total number of pregnancy episodes identified by the algorithm, which had 45 weeks of continuous health plan enrollment after the estimated LMP date. The denominator includes all women aged 12–55 years with at least 45 weeks of health plan enrollment in each respective study year. Pregnancy episodes were anchored in the calendar year of their endpoint date.
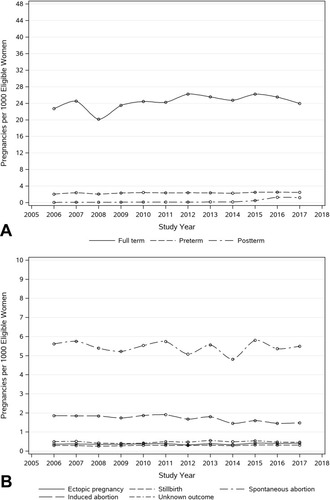
Figure 2 Distribution of gestational age assigned to all liveborn (A), preterm (B), full-term (C), and postterm deliveries (D) pregnancy episodes.
Notes: All liveborn include live, mixed, or unclassified delivery episodes. The pattern of gestational age was evaluated among pregnancies that had 45 weeks of health plan enrollment from LMP. The solid black fill pattern over the bars at 39 weeks shows the portion of episodes that had explicit GA codes on mother or infant records. (71.6% in the ICD-10 era vs 5.2% in the ICD-9).
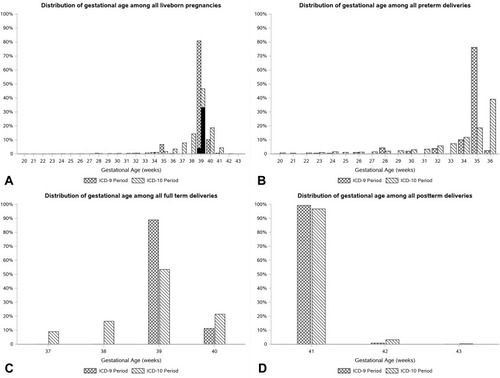
Table 2 Proportion of Pregnancy Episodes with Prenatal Screening Procedure Codes During Pregnancya
Table 3 Median Gestational Age for Prenatal Screening Procedures During Pregnancya