
Figures & data
Figure 1 Flowchart of study populations.
Abbreviations: CBC, contralateral breast cancer; ER, estrogen receptor.
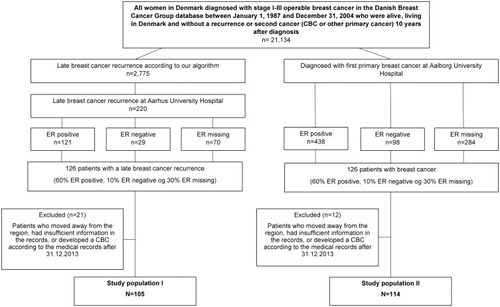
Figure 2 Overview of the algorithm.
Abbreviation: CBC, contralateral breast cancer.
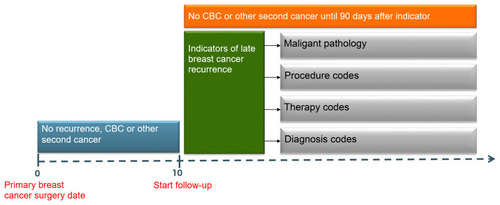
Table 1 Descriptive Characteristics on Patients Diagnosed with Stage I–III Operable Breast Cancer Registered in the DBCG Between January 1, 1987 and December 31, 2004 Who Were Alive, Living in Denmark and Without a Recurrence or Second Cancer 10 Years After Diagnosis, According to Study Population
Table 2 Positive Predictive Values (PPVs) and Corresponding 95% Confidence Intervals (CIs) of Late Breast Cancer Recurrence Identified by Our Algorithm During Follow-Up
Table 3 Estimation of Sensitivity, Specificity, Negative Predictive Value and Likelihood Ratios Among Women Diagnosed with Primary Breast Cancer at Aalborg University Hospital, 1987–2004