
Figures & data
Table 1 Baseline Patient Characteristics, Deaths, and Case Fatality Rate per 1000 Person-Days, by Study Area, Age, Sex, and the Charlson Index
Figure 1 Kaplan–Meier survival curves for hospitalized COVID-19 patients in Northern Italy, 21 February–21 April 2020. (A): overall; (B): stratified by age groups; (C): stratified by sex at birth; (D): stratified by the Charlson Index.
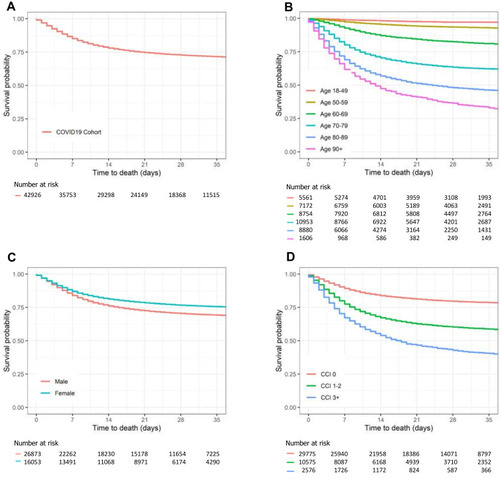
Table 2 Proportion of Surviving Patients at 30 Days from Hospitalization, Estimated Using the Kaplan–Meier Survival Function, by Study Area, Age, Sex, and the Charlson Index
Figure 2 Kaplan–Meier survival curves for hospitalized COVID-19 patients in Northern Italy stratified by age and the Charlson Index, 21 February–21 April 2020. (A): age 18–49 years; (B): age 50–59 years; (C): age 60–69 years; (D): age 70–79 years; (E): age 80–89 years; (F): age 90+ years.
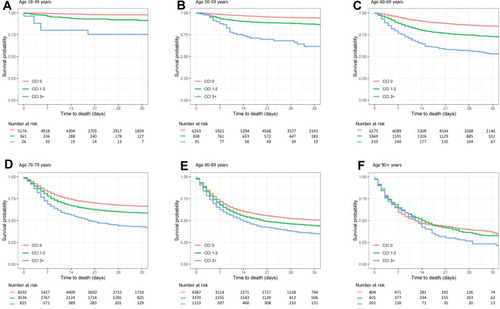
Table 3 Risk of Death for Hospitalized COVID-19 Patients, Estimated Using Cox Proportional Hazards Models for Age, Sex, and Charlson Index. The Model is Adjusted for All Reported Variables and Study Area and Shows the Interaction Between Charlson Index and Age