
Figures & data
Figure 1 Annual Incidence Rate of all CJD Patients by Gender and Age. The incidences increased with increasing age, reaching a peak at the age of 70–79 years in both men and women; the incidence among patients aged 80 and above was still high; low incidence rate observed below 50 years.
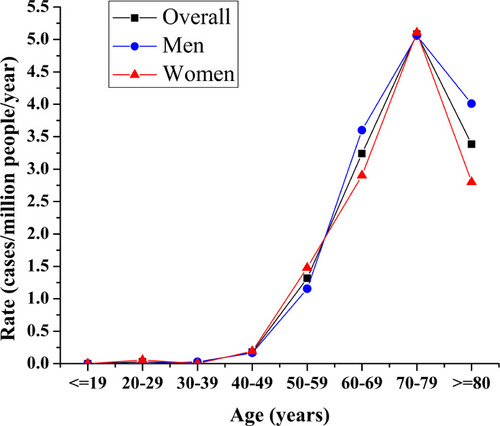
Table 1 Biennial Incidence (A) and Mortality Rate (B) per 1,000,000 Persons of CJD in Taiwan from 1998 to 2017
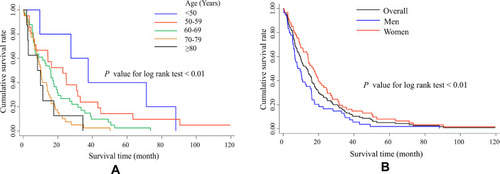
Figure 2 Kaplan-Meier Survival Curves for Patients with Sporadic CJD by Age (A) and Gender (B). Kaplan-Meier curves display time from disease onset to death or to the end of 120 months. The 10-year cumulative survival rates for men and women were 0% and 2%, respectively. Longer survival time was noted in patients with younger age at onset (A), and in women than men (B).
Availability of data and material
The data and raw material could be available after an application to and approval from the Taiwan CDC.