
Figures & data
Figure 1 Flow-chart showing reasons for not being eligible and not being included in Nor-COAST.
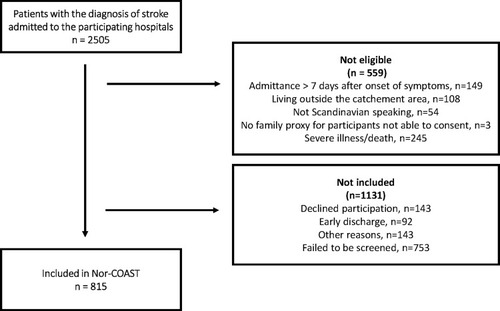
Table 1 Proportion of Patients from the Participating Health Authorities
Table 2 Characteristics of Participants Versus Non-Participants in Nor-COAST
Table 3 Characteristics of Participants Versus Non-Participants Within Each Health Authority
Figure 2 The proportion of patients with mild (National Institutes of Health Stroke Scale 0–4) versus moderate/severe (National Institutes of Health Stroke Scale > 4) stroke among participants and non-participants within different age-groups.
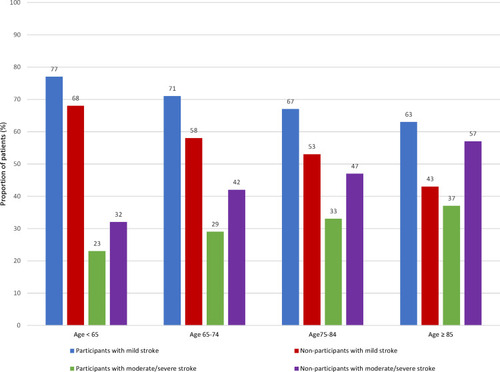
Table 4 Binary Logistic Regression Analysis Showing the Odds Ratio (OR) and 95% Confidence Interval (CI) for Being Included in Nor-COAST According to Baseline Characteristics