112
Views
13
CrossRef citations to date
0
Altmetric
Original Research

Sixty-Day Mortality Among 520 Italian Hospitalized COVID-19 Patients According to the Adopted Ventilatory Strategy in the Context of an Integrated Multidisciplinary Clinical Organization: A Population-Based Cohort Study

, ORCID Icon, , ORCID Icon, , , ORCID Icon, ORCID Icon, , , , , , , , ORCID Icon, , , ORCID Icon, , ORCID Icon, & ORCID Icon show all
Pages 1421-1431 | Published online: 30 Dec 2020

Figures & data

Figure 1 Flow chart synthesizing the clinical pathways of the COVID-19 patients, the respiratory support provided at each step of their hospital stay, and their 60-day mortality. Percentages refer to the previous level in the flow chart, unless otherwise indicated. *With respect to total hospital admissions.

Abbreviations: CPAP, continuous positive airway pressure; NIV, non-invasive ventilation; IMV, invasive mechanical ventilation; ED, emergency department.
Figure 1 Flow chart synthesizing the clinical pathways of the COVID-19 patients, the respiratory support provided at each step of their hospital stay, and their 60-day mortality. Percentages refer to the previous level in the flow chart, unless otherwise indicated. *With respect to total hospital admissions.

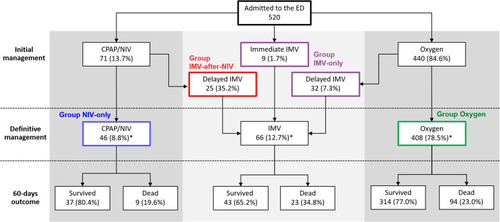
Table 1 Comparison of Demographic Characteristics and Administered Medications Among the Study Subgroups

Figure 2 (A) Duration of continuous non-invasive ventilation (NIV) for patients who received at least one trial of NIV (n=71). (B) Interval between hospital admission and the onset of invasive mechanical ventilation (IMV) for patients admitted to the intensive care unit (n=66). (C) Length of IMV in patients who survived or died at the 60-day follow-up.

Figure 2 (A) Duration of continuous non-invasive ventilation (NIV) for patients who received at least one trial of NIV (n=71). (B) Interval between hospital admission and the onset of invasive mechanical ventilation (IMV) for patients admitted to the intensive care unit (n=66). (C) Length of IMV in patients who survived or died at the 60-day follow-up.

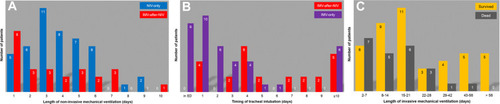
Table 2 Characteristics of Patients Receiving Either Invasive or Non-Invasive Mechanical Ventilation

Figure 3 Crude (A) and adjusted (B) Kaplan–Meier curves for the risk of 60-day mortality in patients belonging to the study groups according to the provided respiratory support.

Figure 3 Crude (A) and adjusted (B) Kaplan–Meier curves for the risk of 60-day mortality in patients belonging to the study groups according to the provided respiratory support.

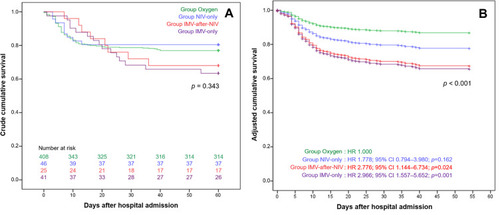
Table 3 Comparison of Mortality Rate Among Study Subgroups