
Figures & data
Figure 1 Time trends in annual standardized incidence rates per 1,000,000 Danish population 1994–2018 (left y-axis) and annual alcohol sales per Danish citizen >18 years in liters of pure alcohol 1994–2018 (right y-axis).
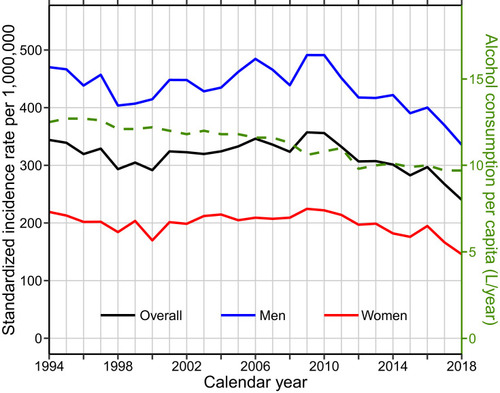
Figure 2 Time trends in annual standardized incidence rates per 1,000,000 Danish population by sex (top/bottom) and age groups (colors).
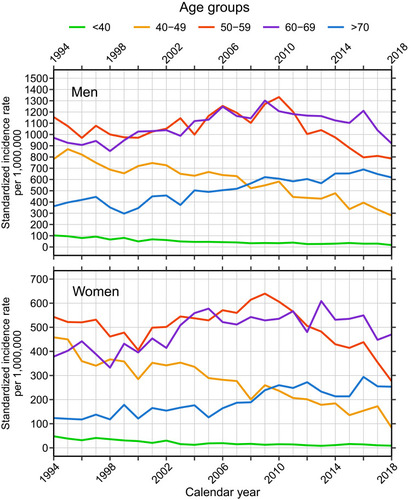
Figure 3 Mean annual incidence rates (2009–2018) by the 98 Danish municipalities standardized to the sex- and age group-distribution of the entire Danish population.
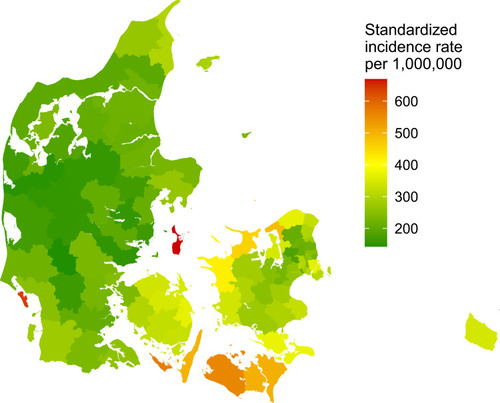
Figure 4 Incidence rates of ALD per 1,000,000 Danish population by 5-year birth cohorts from 1930 to 1979 (colors) and 5-year age groups from 30 to 79 years (x-axis).
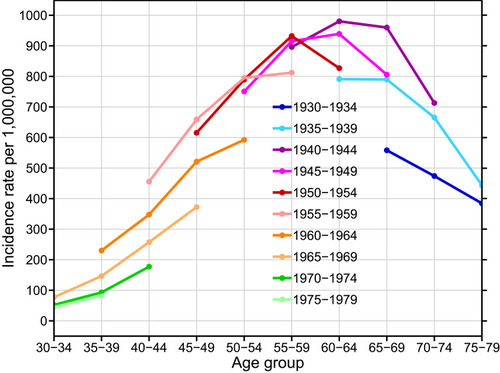
Figure 5 Time trends in hospital care of patients with ALD 1994–2018; the number of all-cause inpatient admissions per patient per person-year (top left). The number of total inpatient days per patient per person-year (top right). The number of ALD-related outpatient visits per patient per person-year (bottom left). The number of all-cause emergency room visits per patient per person-year (bottom right).
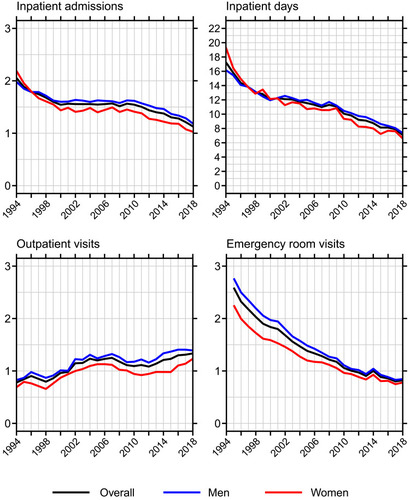
Figure 6 Time trends in sex-, age-, and diagnosis-standardized 1-, 3-, and 5-year mortality (left y-axis) and the proportion of 1-year mortality caused by ALD (right y-axis).
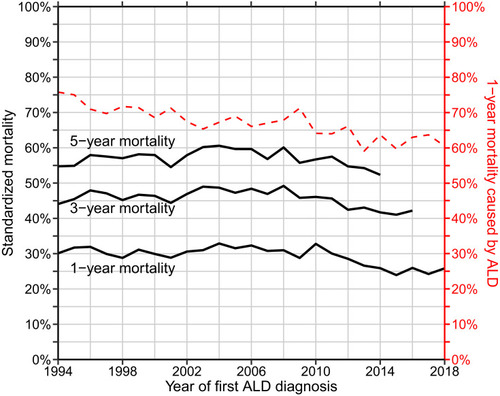
Table 1 Mortality After First Alcohol-Related Liver Disease Diagnosis