
Figures & data
Table 1 Characteristics of Women with and without Antiemetic Medication Prescription Fills During Pregnancy, Norway, 2005–2017
Figure 1 Flowchart of the study population.
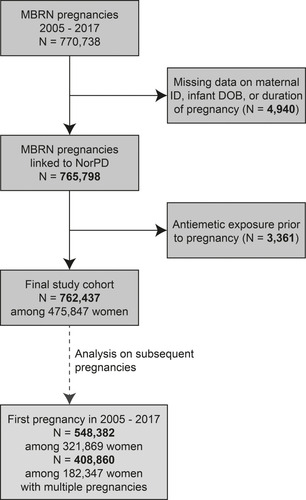
Figure 2 Secular trends of antiemetic prescription fills during pregnancy, Norway 2005–2017.
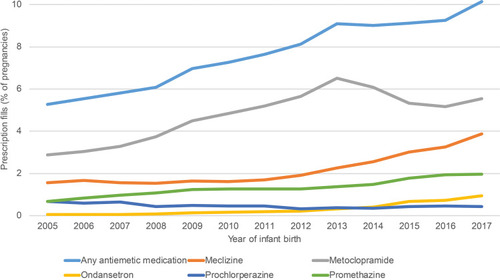
Figure 3 Prevalence of antiemetic medication fills in a given pregnancy, stratified by pregnancy order and history of antiemetic prescription fills. Data are from the Medical Birth Registry of Norway and the Norwegian Prescription Database, 2005–2017, restricted to women with their first pregnancy (irrespective of outcome) in the study period (548,382 pregnancies among 321,869 women, only first 4 pregnancies are shown).
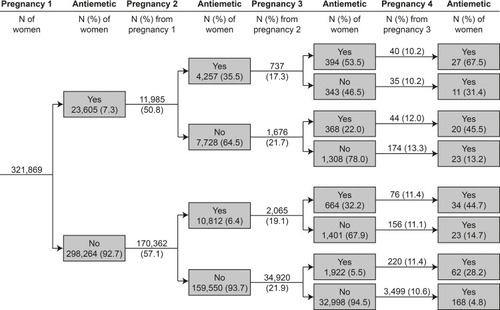
Figure 4 Prevalence of ondansetron fills in a given pregnancy, stratified by pregnancy order and history of ondansetron prescription fills. Data are from the Medical Birth Registry of Norway and the Norwegian Prescription Database, 2005–2017, restricted to women with their first pregnancy in the study period (548,382 pregnancies among 321,869 women, only first 2 pregnancies are shown due to small counts (<10) in subsequent pregnancies).
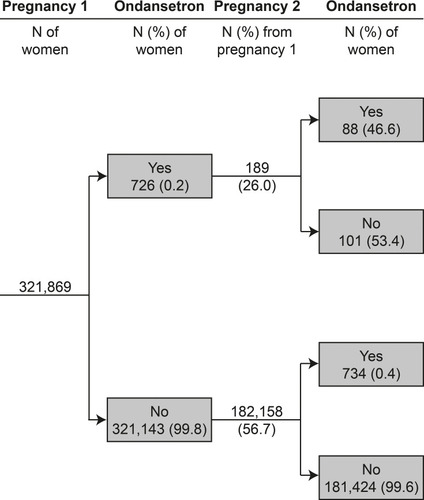
Figure 5 Main treatment pathways of antiemetic prescription fills. The numbers next to the arrows represent the proportion of pregnancies taking the represented step in the treatment path. The numbers in square brackets below the treatments represent the median number of days on this treatment. A treatment gap is defined as an interval longer than 14 days between the end date of the first treatment step and the start data of the subsequent treatment step. Proportions do not add up to 1.00 as only main pathways containing at least 1% of pregnancies (n=582) with antiemetic prescriptions fills are shown.
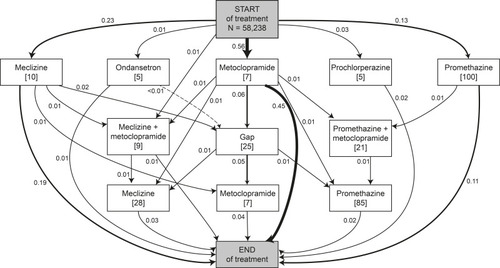
Table 2 Characteristics of Women Who Filled Prescriptions for Ondansetron Deviating from Treatment Guidelines, Norway, 2005–2017a