Figures & data
Table 1 Search strategy
Figure 1 PRISMA flow diagram.
Abbreviation: PRISMA, Preferred Reporting Items for Systematic Reviews and Meta-Analysis.
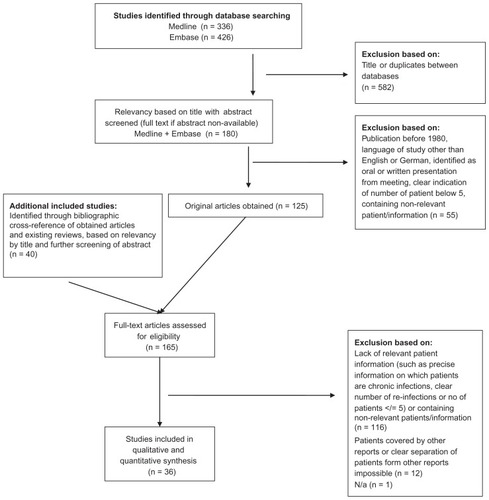
Table 2 Characteristics of studies with patients in the one-stage revision cohort
Table 3 Characteristics of studies with patients in the two-stage-revision cohort
Table 4 Methodological characteristics of included studies
Figure 2 Forest plot illustrating absolute risk of reinfection in ascending order with relative weight of individual studies.
Notes: Event rate, absolute risk of reinfection; lower/upper limits, 95% confidence interval; total, number reinfected/number reimplanted.
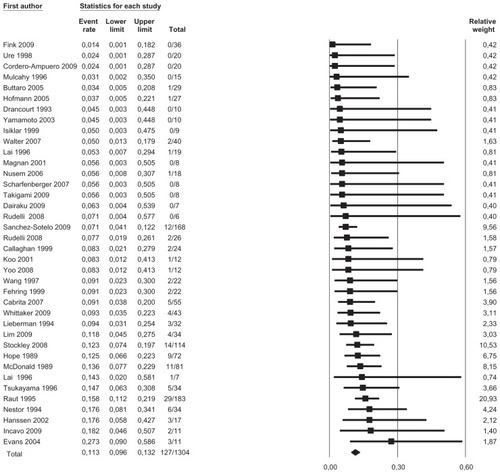
Figure 3 Forest plot illustrating stratified analysis by type of revision performed with relative weight of individual studies.
Notes: Event rate, absolute risk of reinfection; lower/upper limits, 95% confidence interval; total, number reinfected/number reimplanted.
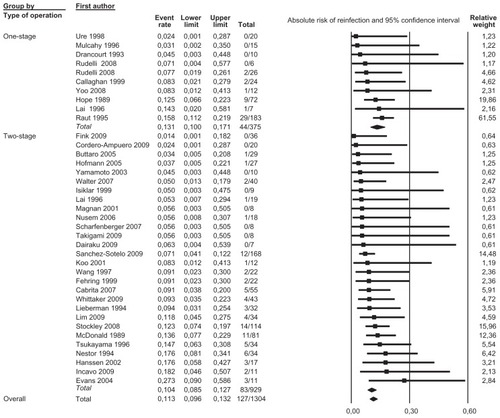
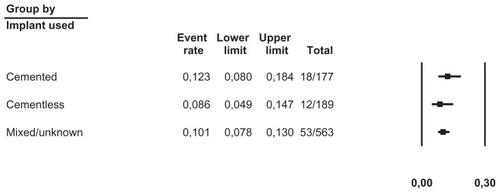
Figure 4 Forest plot illustrating two-stage revision stratified by implant used in reimplantation.
Notes: Event rate, absolute risk of reinfection; lower/upper limits, 95% confidence interval; total, number reinfected/number reimplanted.
Abbreviation: CI, confidence interval.
Abbreviation: CI, confidence interval.